ICICIPRULIFE - Monthly ChartTrendline Break out after long period and if it breaks August 24 high, enter long
ICICIPRULI trade ideas

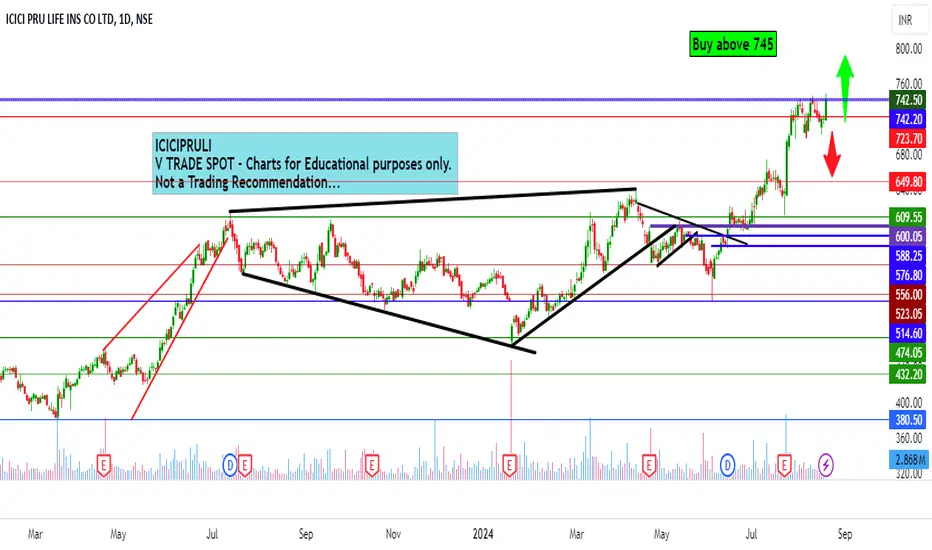
ICICI Prudential Life Insurance intraday level for 21st Aug #ICIICICI Prudential Life Insurance intraday level for 21st Aug #ICICIPRULI
Buying may witness above 745
Support area 735-737. Below ignoring buying momentum for intraday
Charts for Educational purposes only.
Please follow strict stop loss and risk reward if you follow the level.
Thanks,
V Trade Point
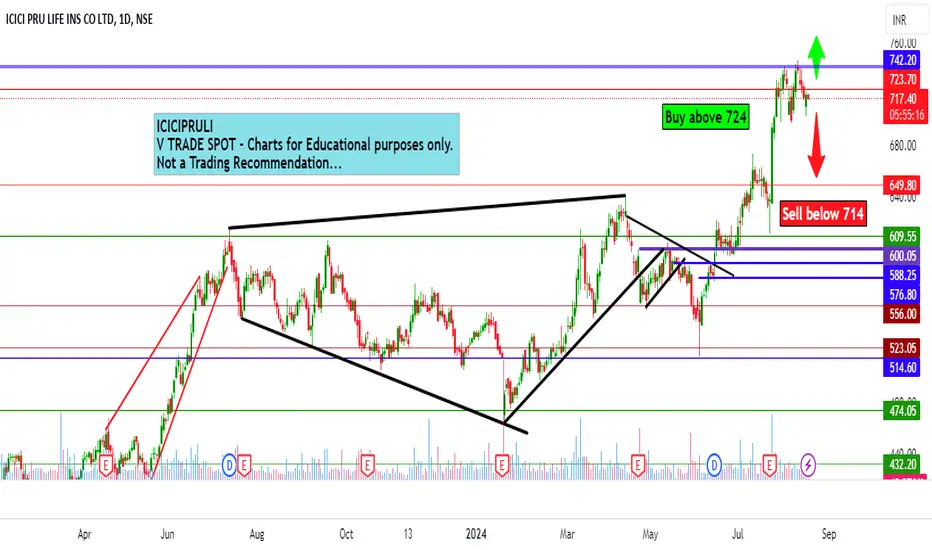
ICICI Prudential life insurance intraday level for 19th Aug #ICIICICI Prudential life insurance intraday level for 19th Aug #ICICIPRULI
Buying may witness above 724
Support area 714. Below ignoring buying momentum for intraday
Selling may witness below 714
Resistance area 724. Above ignoring selling momentum for intraday
Charts for Educational purposes only.
Please follow strict stop loss and risk reward if you follow the level.
Thanks,
V Trade Point
ICICIPRULI - Inv H&SStock has formed H&S within the ascending monthly channel...
A breakout abv the Inv H&S would target previous swing high 724 initially to be resisted by the double top
After some reasonable consolidation the target is open for the trendline resistance
Disclaimer : This idea is for educational/informational purpose only and does not constitute a trading recommendation. Kindly do your research or consult a SEBI registered advisor before investing

3 Year Breakout ICICI Prudential 3 Year Breakout ICICI Prudential Swing Trade
Buy Price - 730/-
T1 - 960/- (30%)
T2 - 1100/- (58%)

BUY FOR TARGET WITH STRICT STOPLOSSInverse head and shoulder pattern in ICICI Prudential Life Insurance Company, risk reward is good. ICICI Prudential Life Insurance Company Ltd carries on business of providing life insurance, pensions and health insurance products to individuals and groups. The business is conducted in participating, non-participating and unit linked lines of business. These products are distributed through individual agents, corporate agents, banks, brokers, sales force and company's website.
It is promoted by ICICI Bank and Prudential Corporation

Review and plan for 24th July 2024Nifty future and banknifty future analysis and intraday plan in kannada.
Stocks to watch included.
This video is for information/education purpose only. you are 100% responsible for any actions you take by reading/viewing this post.
please consult your financial advisor before taking any action.
----Vinaykumar hiremath, CMT

ICICI PRU weekly ChartInverted Head and Shoulder
RSI above 60 Daily & weekly
Monthly RSI near 59
Resistance 724
support 533
need to sustain above 610
expected level 725

ICICI Prudential Life Insurance Company LtdTarget given in the chart - SL as per your apetite
Fundamentals
Market Cap
₹ 86,787 Cr.
Current Price
₹ 603
High / Low
₹ 616 / 381
Stock P/E
95.1
Book Value
₹ 76.9
Dividend Yield
0.10 %
ROCE
10.0 %
ROE
8.45 %
Face Value
₹ 10.0
Price to book value
7.86
Intrinsic Value
₹ 80.9
PEG Ratio
-7.39
Price to Sales
1.11
Debt
₹ 1,200 Cr.
Debt to equity
0.11
Reserves
₹ 9,631 Cr.
Promoter holding
73.3 %
Pledged percentage
0.00 %
EPS last year
₹ 5.65
Net CF
₹ -1,168 Cr.
Price to Cash Flow
970
Free Cash Flow
₹ -105 Cr.
OPM last year
-1.62 %
Return on assets
0.33 %
Industry PE
44.5
Sales growth
52.0 %

ICICI Prudential Life Insurance Intraday level for 11th July #ICICICI Prudential Life Insurance Intraday level for 11th July #ICICIGI
Buying opportunity above 666
Support area 660. Below ignoring buying opportunity
Charts for Educational purposes only.
Please follow strict stop loss and risk reward if you follow the level.
Thanks,
V Trade Point

ICICI Prudential: Breakout on Strong VolumeICICI Prudential has successfully broken through a key resistance level with strong volume, indicating potential for further upward movement. The stock shows significant bullish momentum, supported by high trading volume, confirming the reliability of this breakout. Traders should watch for continued strength in the coming sessions. Proper risk management is essential, with attention to support levels below the breakout.

Share swing strong uptrendThey share sowing uptrend with volume next target will be 671 and if cross 671 then next target will be 703 so for short term 671 and for one month 700 three approx cam gate

ICICI PRUDENTIAL Icici prudential is going to hreakout with Inverse Head & Shoulder patter
Buy at - 625
Target - 710
SL - 590

ICICI PRUDENTIAL Icici prudential is going to hreakout with Inverse Head & Shoulder patter
Buy at - 625
Target - 710
SL - 590

ICICI Prudential Life Insurance Intraday level for today 13thICICI Prudential Life Insurance Intraday level for today 13th June #ICICIPRULI
Buying opportunity above 588
Stop Loss area 582
Selling opportunity below 575
Stop Loss area 582
Charts for Educational purposes only.
Please follow strict stop loss and risk reward if you follow the level.
Thanks,
V Trade Point

Icici Prudential share looks like forming HS formationIf goes beyond 460 range then we can consider as a breakout. I had little positions but closed around 450 range. Planning to re enter only after breakout.
HS - Head and Shoulder format.

ICICI PRULI 1W Timeframe PROJECTIONICICI PRULI 1W Timeframe PROJECTION
The trend is bullish.
As per Elliott wave theory and SMC Concept both have a bullish scenario

Intraday view for ICICIPRULIIntraday view for ICICIPRULI for today 14th May 2024
Buy entry only above 602 if sustain...
590 below no chance for bulls
Charts for educational purposes only.
Not a Trading Recommendation.
Thanks,
V Trade Point

🔥 20% - 30% Upside Potential | ICICIPRU🔥 20% - 30% Upside Potential | NSE:ICICIPRULI
✅ Buy Level - Rs 510- Rs 520
✅ SL - Rs 475
✅ Target - Rs 568/649/728
✅ Ascending Triangle Formation
✅ Golden Crossover at 1 Day Timeframe
Trade :-
✅ Buy Future Rs 510- Rs 520
✅ Buy Equity
✅ Buy 575 CE @ Rs 10-15 | CMP Rs 13
Look at the chart for more information

ICICI Pruli: Inverted Head and Shoulder pattern on weekly TFStock has made an inverted H&S Pattern on Weekly TF which indicates the bullishness in the stock.
Key resistance levels are still not taken out which requires a closing above 615 level.
Stock may touch its ATH after sustaining above 615 levels.
DISC: Only for educational purposes.

Review and plan for 25th April 2024 Nifty future and banknifty future analysis and intraday plan in kannada.
This video is for information/education purpose only. you are 100% responsible for any actions you take by reading/viewing this post.
please consult your financial advisor before taking any action.
----Vinaykumar hiremath, CMT

Weekly and monthly breakeout stock or soon to be break outonce cross 647 on closing . then it might have more .....

Reverse head and shoulder in ICICI prudentialReverse head and shoulder pattern in ICICI prudential, go long in ICICIpruli
