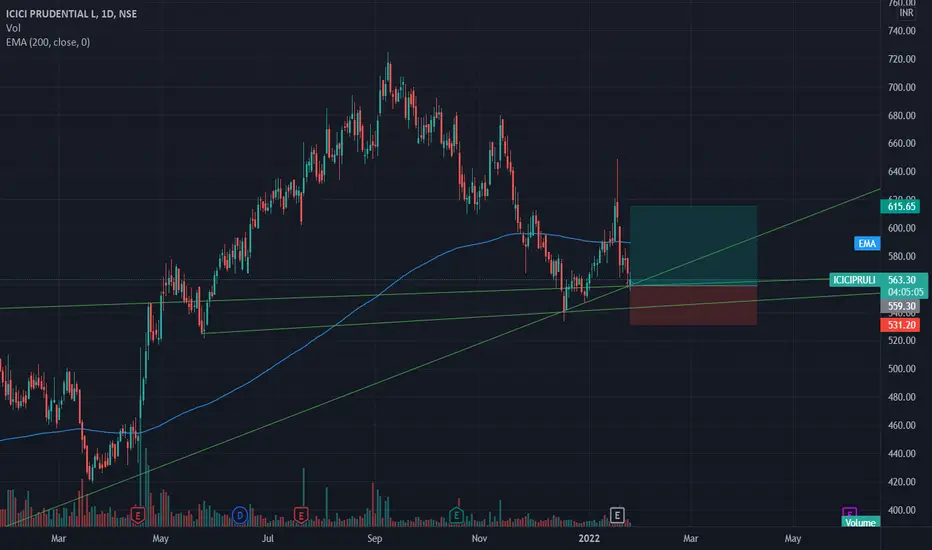
ICICI Prudential BreakoutThe stock has broken out and retested, therefore may undergo a reversal rally. Trade is supported by brokerage calls and Supports Nearby.
Risk Reward Ratio - 2:1
SL is placed below support zone & the lower trendline. The target is placed near resistance.
ICICIPRULI trade ideas
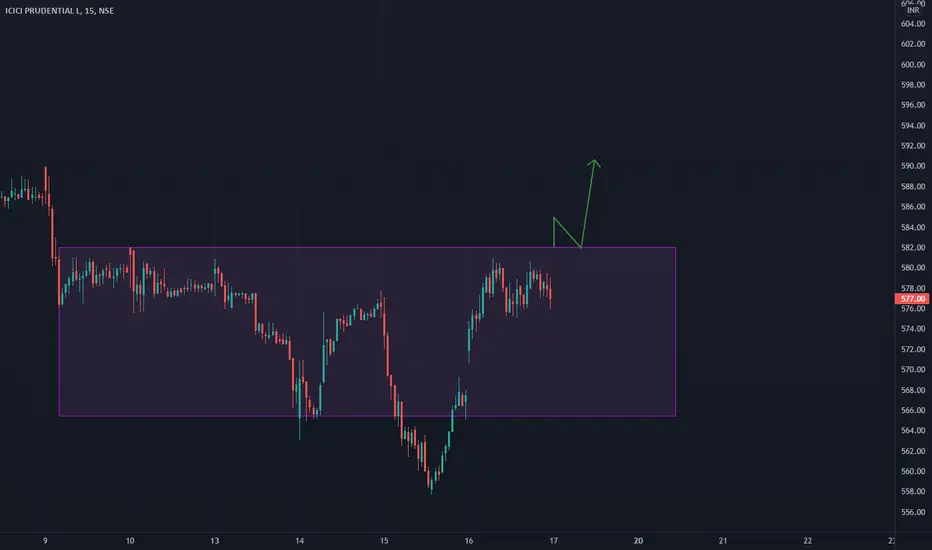
ICICIPrudencial Bearish or Bullish ???1. 1 Day: Delivery volume increased by 42.4% over 5 day average
2. Strong Profit Booking at the Boto of regression channel , can invest 20% in it out of total Insurance sector .
3. Can see some Pull back up trade as shown as per Target levels .
4, Wait for 15 Minuts Cnfirmation Candle
5. Its Buy signal by Trading Indicator . invest 20%


ICICI PRUDENTIAL - Price Action Analysis NSE:ICICIPRULI has already been generated Bullish Harmonic Bat pattern level of .886 at price 540.
Trend reversal confirmation only comes when price will hold 540 and above level and generates HH- HL.
BUY : Buy will only happens if price retests S1(523-543) level again and creates reversal candle with good Volume .
SELL : Any rejection candle at resistance level with confirmation will generate sell opportunity.

ICICI pru - @ trendline supportQuality, large cap name becoming available after a decent correction
Buy here and on dips. Another portfolio buy so not giving a SL here


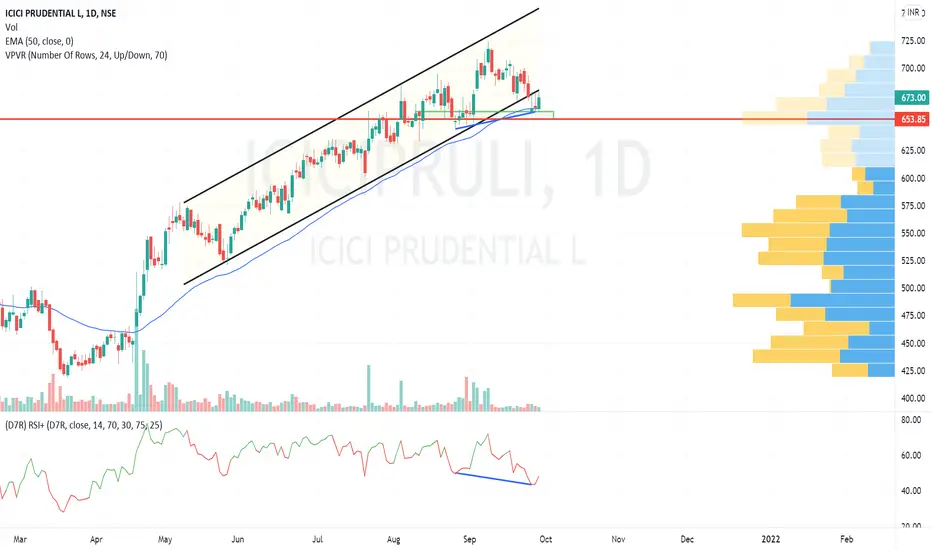
ICICIPRULI - Strong UptrendCurrently stock is in strong uptrend, this is the third time price is going to touch the trendline, price reaction will be aggressive after breaching marked levels, we've also marked a breakout zone where price can consolidate to respect the trendline perfectly.

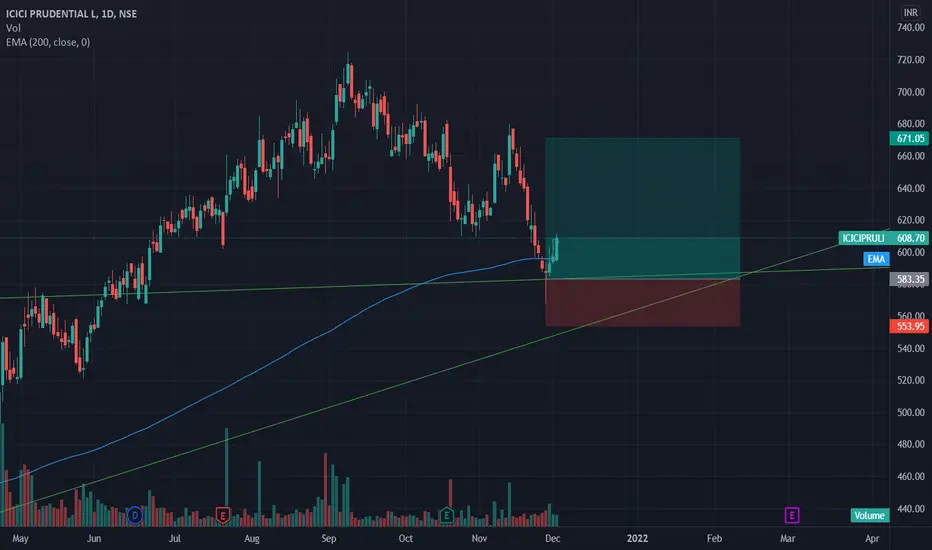
ICICI Prudential Breakout-RetestThe stock has broken out and retested, therefore it may undergo a rally. Trade is supported by brokerage calls and Supports Nearby.
Risk Reward Ratio - 3:1
SL is placed below support zone, 200 EMA & the upper trendline. The target is placed near swing high.
IcicipruWe can go long from strong support zone if come 600 level and bullish candle conformation watch and wait for level 2nd conformation 200 Ema support
It's only education purpose.not advice for investment discuss with your financial adviser.

ICICIPRUDENTIAL - Divergence assisted from demand zone.
The stock broke the channel but found support at the immediate demand zone and 50 EMA.
The follow up should be bullish.
Buy ICICIPRULI around 700 for trgt 780 with SL 660Buy ICICIPRULI around 700 for trgt 780 with SL 660 in a month or two

ICICI PRUDENTIALHello Traders, those who want to go long with ICICIPRU go ahead above 707 only with SL680 for the achievable target 805! have a good luck & safe trading!!


ICICIPRULI Long Term InvestmentICICIPRULI Long Term Investment
Target @ Exit only if Weekly MA(14) breaks or Stop Loss of Rs600 hits


Broken ChannelStock Analysis: ICIC Pru has broken the channel on monthly time frame, it is good buy around marked supply zone with demand zone as a stop loss for long term target given on the chart.

Fresh break out Above 600break out retested successfully keep Sl 592 for long Position, Happy trading.

ICICPRULI shows dark cloud cover candle at top with RSI negativeDark Cloud cover, candle stick, RSI is on negative diversion
590 PE may give soem good return ;)


Icici PrudentialIcici prudential trading abv 30WSMA and given a long consolidation breakout with Volume
