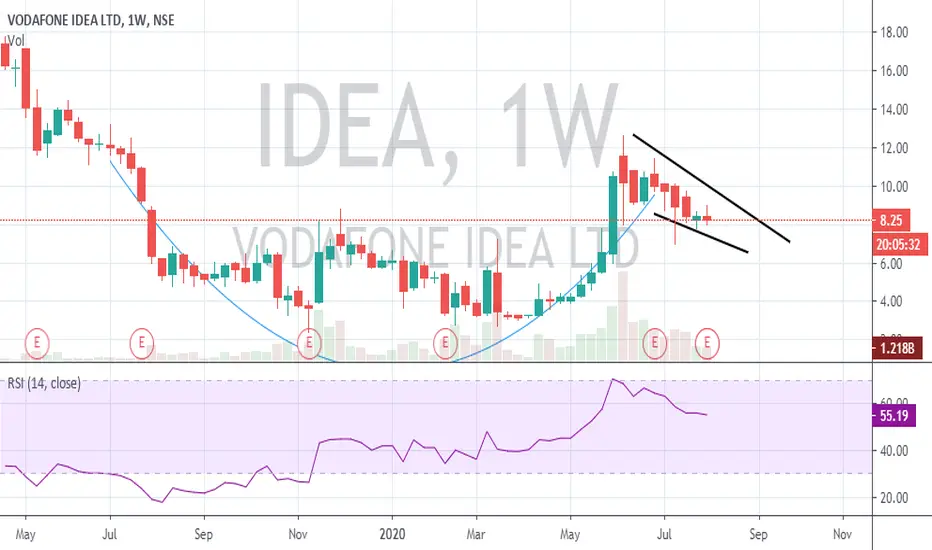
Vodafone IDEA LTD Falling Wedge Setupprice in falling wedge and ready to breakout if we breakout here than good for long at retest
IDEA trade ideas


IDEA- AccumulationIDEA in accumulation Phase. Once it crosses Rs.8.20 is It will be in Bullish zone. Rs.2.35 Is the support zone. NSE:IDEA


buy idea shares...sure target is 2.5 per sharebecause of strong rejection in previous support levels

IDEA NEAR SUPPORT 7.5/8. IDEA IS NEARING SUPPORT. A BREAK BELOW 7.5 WILL INVALIDATE THE BULLISH MOVE.


Cup and handle pattern formation in Idea-inits going to upward currently its traded on daily support trend line if fail then the stock touch near to 17.15 in a week.

Idea - Cup of woes may endVodafone Idea - Looks like a cup n handle on weekly. I am not sure. But let us see. Keep tracking.

Vodafone Idea can go up * Add to your watchlist*Triangle and above 1h 200 EMA, Wait for BO and enter with good R:R.
** Educational purpose only **
Do ur own research before taking any investment decision
This is my personal view.


Idea is heading for 28-30rs range in mid term to long termIdea is showing strong view on monthly chart. There are very high chances for Idea to touch 28-30rs in mid to long term.
I am holding 25K shares

Voda Idea : Vey Strongly Buy. Rounding Bottom and Inverse Head..Voda-idea share price has made rounding bottom and inverse head and shoulder pattern.
When you study Rounding bottom pattern, it is said it is best if it has head and shoulder pattern inside. This is happening in this stock price chart.
STOCKMAN IDEA View:
Position : Strong Buy
Stop Loss : 9
Target : 18
CMP: 12.4

Vodafone Idea – Long for swing tradeBuy @ 9.50 – 10
T 1 – 14
T2 – 17.50
T3 - 21
SL - 8.35
Note: This is my view for educational purpose only.


vodafone idea making ascending triangle - keep eye and ear both vodafone idea making ascending triangle - keep eye and ear both on it.

What after Results ! Up or Down ! I think Idea is in making Cup and handle pattern in weekly chart shouldn't close below 7 and upside 10-14 big resistance.
If managed to close above 14 we can see levels of 20+ soon !
Close below 7 avoid !
IDEA - Swing
> A high demand area in daily and hourly time frame
> Trend line breakout with above-average volume and candle
> Inside candle after bullish candle

Vodafone Idea getting ready for a ride. Don't MissThe most under rated stock is now on its dream run, get ready for the big rally. As per my analysis Its now trading inside the triangle pattern so a breakout to the upside can give target of TP1 - 14.45 TP2 - 18 and TP3 - 23 keep stoploss under 9 as it is the bottom of the flag pattern. Good luck and enjoy the ride any bad news for the stock can ruin the rally but it's less expected keep stoploss and ride.
