Indian Energy Exchange BuyIndian Energy Exchange taking support at trend line. Buy @CMP (190) with SL of 178 and target of 200 and 210
IEX trade ideas

IEX_Near key Resistance Zone- Price near one of the key resistance zone (but with decent volume
- Price sees some difficulty in the zone with long wick on top
- Next few days will be interesting to watch
- Watch & Play

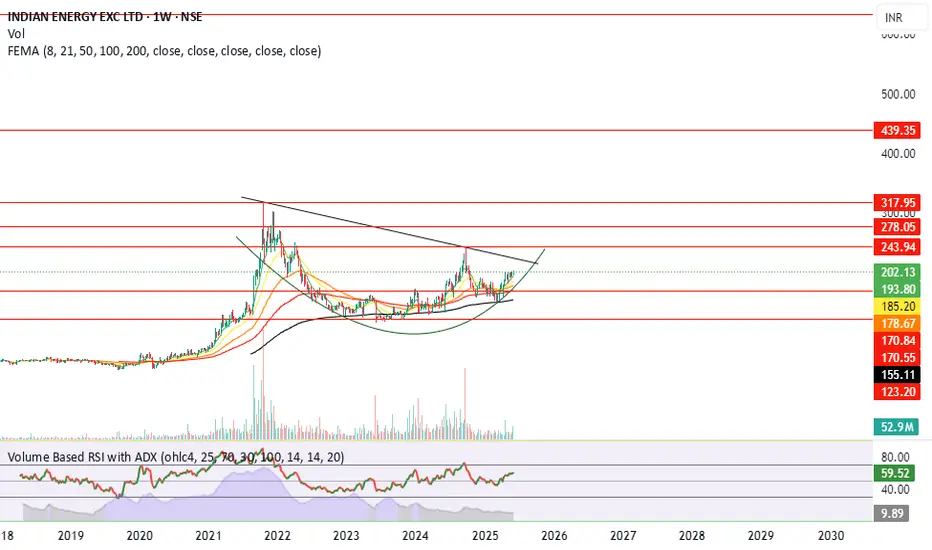
Buy IEX @202 AVG @ 175 SL below 125 TGT 275/315/440/630Stock is making Cup and handle pattern on the weekly chart and looks extremely bullish for the medium term for the above mentioned targets. For short term, follow the first and second target.
Indian Energy Exchange | 250% returns expected (2.5x)INDIAN ENERGY EXCHANGE
Monthly time frame
Stock in uptrend since June 2023
Stock has broken out of the blue channel consolidation after 2 years
Stock is following a rounded bottom pattern
Stock riding above 20- & 50-month moving averages
RSI > 60
MACD crossover has happened, signalling beginning of bullish momentum
Weekly time frame
Breakout and retest of the consolidation channel confirmed
Stock is following a rounded bottom pattern
Stock riding above 20-, 50- & 200-week moving averages
Golden crossover has just been completed around mid Jul 2024
RSI > 60
MACD signalling beginning of bullish momentum
Daily time frame
Stock possibly in the process of making a higher low
Stock is in the yellow channel of upward consolidation
Stock riding above 50- & 200-week moving averages, just now touched 20 DMA
RSI > 50 which is still considered the bull zone
Conclusion
Entry: 185
Stop Loss: 160
Target 1: 235
Target 2: 315
Target 3: 444
Fundamentals
ROCE = 50 {Ideal > 15}
ROE = 38 {Ideal > 15}
Stock PE (46) < Industry PE (58) {Stock PE should ideally < Industry PE}
Int Coverage = 173 {Ideally > 2}
FII stake has increased from 10.89% to 11.66% last quarter

Improving sales, Forming Cup and Handle Pattern with SL 160,M cap 17194 cr and ROCE 53%, Company with strong FA, Can be added for long term, trg in 2 years 500.

Cup with Handle pattern in IEXA nice Cup with Handle pattern is forming in IEX.
A good 90% ROI potential in medium term as per the technical chart pattern.
Currently it is trading near it's median PE with great ROE & ROCE numbers, high margin due to monopoly with steadily growing EPS, which adds conviction for it's upside momentum.
Please refer to the drawings for details.
It has potential to go much higher in long term, will share the Elliott Wave Chart later.
Do your own due diligence before taking any action.
Peace!!

Cup Handel PatternBig cup has formed, handle is in process. Strong bullish if pattern completes. We can go long if breaks above 244

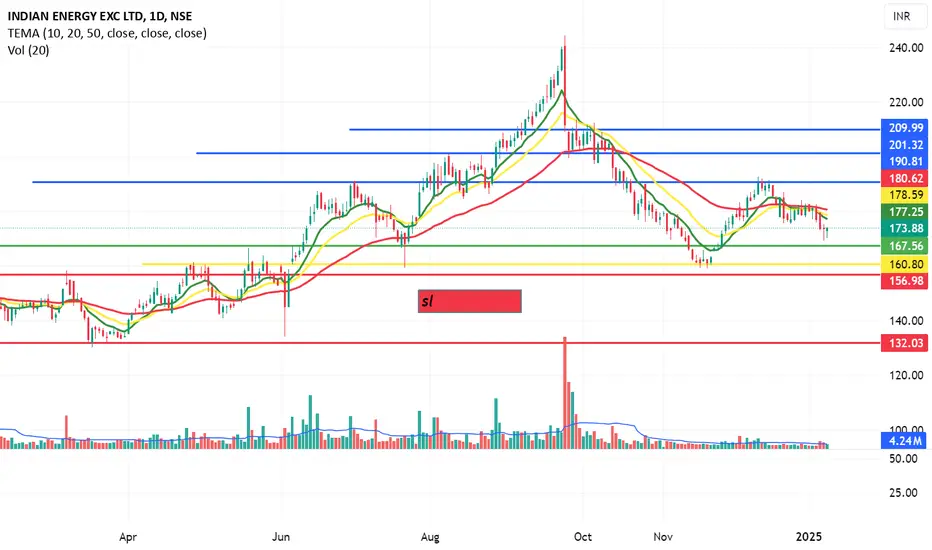
IEX cup and handle pattern•CMP: ₹185| Stop Loss: ₹175 Target:*204/225
DISCLAIMER: I am NOT a SEBI registered advisor or a financial adviser. All the views are for educational purpose only.


IEXPrice is making triangle. Now traded at lower end of triangle. Very high possibility that it will move upper.
This idea is for Educational purpose and paper trading only. Please consult your financial advisor before investing or making any position. Facts or Data given above may be slightly incorrect. We are not SEBI registered.

IEX is bearish nowIEX is now in downtrend and at around 190 it face resistance and then it will fall more than 116. so watch it observe it and learn understand it

IEX Trading Near Inflection PointIEX Stock Price Trading near Multiyear Support . After a strong corrections this stock price try to construct Double Bottom Pattern and if this pattern activate then high probability price outperform .

IEXNSE:IEX
Indian Energy Exchange Ltd
good for mid term
target is 200 ++
rsi=40
trading at support 173
sl- below 155

IEXNSE:IEX
Indian Energy Exchange Ltd
good for mid term
target is 200 ++
rsi=40
trading at support 173
sl- below 155
IEX LONGSimple Setup
Resistance Level : 245 - 260
Support Level : 160 - 170
View is negated with a close below 160
Good for short term. Breakout above 260 will become a good pick for long term.
My view is for educational or study purpose only.
It is not a buy/sell recommendation.
Contact your financial advisor before taking any investment or trade decision.

Go long in IEX only above 195We are noticing a nice uptrend in IEX. From here, the next strategy is that if IEX closes above 195 on daily frame, then we can expect targets of 205,211 & 234.
Stoploss for this investment can be placed near 180.
There is a chance of nifty falling down from here, so maintain your strict stoploss at 180.

IEX nice reversal Slowly and steadily trying to reach the zone. Reversal is started. Plan for a year of patience.
Happy New Year


IEX SHARE PRICE CASE STUDYPrice Trading Near Multiyear Multiple Support Zone. such as Multiyear Momentum line &
Previous Made Inverse Head & Shoulder Pattern. Neckline act as a Support Now.

IEX looking weakIndian Energy Exchange is looking weak if it close below 175. We can expect a good breakdown below 175 which can result in downside targets of 164 & 159.

IEX NEARBY REVERSAL TECHNICALY NO FUNDAMWNTALS ASPECT WHY :-
1. As shown in this vedio green support line was strong resistance.
2. Two gann fan crosses at same line.
3.If you look gann square of 9 rejection level(244) is almost in 60 degree and where taken support now is almost 315 degree 169 which is odd number square of 13 as well.no ndicatores are showing reversal at these level.

Analyzing Indian Energy Exchange Ltd (IEX) Chart PatternsAnalyzing Indian Energy Exchange Ltd (IEX) Chart Patterns: An In-Depth Guide to Potential Breakout and Wave Structure
The attached chart of Indian Energy Exchange Ltd. (IEX) illustrates three significant chart patterns that suggest a potentially strong bullish outlook. These patterns, namely the Head and Shoulders (Inverse), Triangle, and Cup and Handle, collectively indicate a powerful upward momentum upon successful breakout, especially if the price crosses the previous high of ₹317.90. This price level could signal the onset of a primary third wave under the Elliott Wave Theory, traditionally known as one of the strongest waves in a bull cycle.
1. The Triangle Pattern
The Triangle pattern on this weekly chart appears to have formed over a substantial period, signifying a consolidation phase where the price fluctuates within narrowing boundaries. The triangle structure generally signifies indecision in the market but also an accumulation phase. As this pattern nears its apex, a breakout becomes more probable, offering a potential directional cue.
Interpretation: A breakout from this triangle, especially if accompanied by significant volume, can indicate a strong trend continuation or reversal. In this case, as it converges with other bullish patterns, a breakout above ₹317.90 could signal strong upward momentum.
Psychological Implication: The Triangle pattern, especially when extended over a lengthy timeframe, can build up energy that often results in a sharp move in the breakout direction. This makes it a critical level for traders to monitor.
2. The Inverse Head and Shoulders Pattern
An Inverse Head and Shoulders pattern is visible, typically recognized as a bullish reversal signal. The pattern here consists of a Left Shoulder, Head, and Right Shoulder:
Formation Explanation:
The Left Shoulder represents an initial decline and subsequent rebound.
The Head forms as a deeper decline followed by another recovery, marking the lowest point and potential reversal zone.
The Right Shoulder signals a less severe dip, indicating waning selling pressure.
Breakout Point: The neckline (marked by the breakout point) lies near the resistance at ₹317.90. A decisive breakout beyond this neckline can signal a reversal from bearish to bullish.
Target Projection: The target from this pattern is typically estimated by measuring the distance from the Head to the neckline and projecting it upward from the breakout point. In this case, a successful breakout above the neckline could push the price towards the next psychological targets around ₹400-₹450.
3. Cup and Handle Pattern
The Cup and Handle is another prominent bullish continuation pattern forming on this chart. This pattern suggests a temporary consolidation before a potential breakout to the upside. Here’s how it has formed:
Cup Formation: The rounded shape of the Cup signifies a slow bottoming process, indicating that buyers are regaining control.
Handle Formation: The Handle is a short consolidation period, often a slight pullback, representing a pause before a potential upward breakout.
Breakout Potential: A breakout above the top of the Handle, which aligns closely with the ₹317.90 resistance level, often leads to significant upward momentum. The target is typically estimated by measuring the depth of the Cup and projecting it from the breakout point.
Key Resistance and Target Levels
Immediate Resistance: The crucial level to watch here is ₹317.90, the recent high, as it serves as a convergence point for all three patterns. A breakout above this could trigger aggressive buying interest.
Projected Targets:
Short-term target: ₹375
Medium-term target: ₹425-₹450, aligning with the upper levels suggested by the patterns.
Elliott Wave Analysis: Potential Main 3rd Wave
The Elliott Wave Theory classifies price movements in five-wave patterns in the direction of the primary trend, where the third wave is often the strongest. Assuming the structure here aligns with Elliott Wave principles:
Wave 1: The initial rally.
Wave 2: A corrective pullback, forming the base for Wave 3.
Wave 3: Upon crossing ₹317.90, the main third wave could be in play. This wave is often the longest and most powerful in an impulsive sequence, potentially driving prices significantly higher.
Volume Confirmation
A breakout accompanied by strong volume would further validate these patterns, indicating that institutional interest and retail enthusiasm are backing the move. Volume is crucial for confirming the strength and sustainability of any breakout.
Conclusion
This chart presents a technically compelling case for a bullish breakout if IEX can overcome the resistance at ₹317.90. The convergence of the Triangle, Inverse Head and Shoulders, and Cup and Handle patterns enhances the probability of an upward breakout, potentially aligning with a powerful third wave under the Elliott Wave Theory.
Investors and traders should monitor ₹317.90 closely, as a breakout above this level could set IEX on a path towards ₹375 and potentially ₹450. However, it’s essential to manage risk, especially with initial stops below critical support levels. Volume confirmation will be key to ensuring the strength of any move beyond ₹317.90.

IEX S/R Support and Resistance Levels:
Support Levels: These are price points (green line/shade) where a downward trend may be halted due to a concentration of buying interest. Imagine them as a safety net where buyers step in, preventing further decline.
Resistance Levels: Conversely, resistance levels (red line/shade) are where upward trends might stall due to increased selling interest. They act like a ceiling where sellers come in to push prices down.
Breakouts:
Bullish Breakout: When the price moves above resistance, it often indicates strong buying interest and the potential for a continued uptrend. Traders may view this as a signal to buy or hold.
Bearish Breakout: When the price falls below support, it can signal strong selling interest and the potential for a continued downtrend. Traders might see this as a cue to sell or avoid buying.
20 EMA (Exponential Moving Average):
Above 20 EMA(50 EMA): If the stock price is above the 20 EMA, it suggests a potential uptrend or bullish momentum.
Below 20 EMA: If the stock price is below the 20 EMA, it indicates a potential downtrend or bearish momentum.
Trendline: A trendline is a straight line drawn on a chart to represent the general direction of a data point set.
Uptrend Line: Drawn by connecting the lows in an upward trend. Indicates that the price is moving higher over time. Acts as a support level, where prices tend to bounce upward.
Downtrend Line: Drawn by connecting the highs in a downward trend. Indicates that the price is moving lower over time. It acts as a resistance level, where prices tend to drop.
RSI: RSI readings greater than the 70 level are overbought territory, and RSI readings lower than the 30 level are considered oversold territory.
Combining RSI with Support and Resistance:
Support Level: This is a price level where a stock tends to find buying interest, preventing it from falling further. If RSI is showing an oversold condition (below 30) and the price is near or at a strong support level, it could be a good buy signal.
Resistance Level: This is a price level where a stock tends to find selling interest, preventing it from rising further. If RSI is showing an overbought condition (above 70) and the price is near or at a strong resistance level, it could be a signal to sell or short the asset.
Disclaimer:
I am not a SEBI registered. The information provided here is for learning purposes only and should not be interpreted as financial advice. Consider the broader market context and consult with a qualified financial advisor before making investment decisions.
