INDUSINDBK-Expected to be Bullish breakout @ 1170 INDUSINDBK-Observations:
----> Stock trending upwards.
----->Previously false breakout happens at this zone 1170-1185.
------>Now expected to break the Resistance and buyers take the price towards high of this zone and wanted to test supply zone at 1210-1230.
INDUSINDBK trade ideas

Trendline Breakout - Small SL trade
Follow Strict SL
PS : Only for learning purpose. Please consult your financial advisor before investing.

INDUSINDBNK INTRADAY IDEA ON 27-04-2023in INDUSINDBANK we will take a long trade,this content is made for learning and educational purposes only. we are not responsible for any losses or profits.

Goog areas to tradeIt is in a very important area of price where a bug rally is aspected so keep a eye on it

INDUSINDBK bank is going gown good time to shortYou can short INDUSINDBK now it is going down and completed the retest also so u can earn a good profit
Option buyers can buy put

INDUSINDBK Short OpportuityIf price comes at entry level before reach at target level then go for short.
Trade at your own risk.

Indusind Bank - Analysis on 7-3-2023 - Buy over 1255 Closing Indusind Bank - Analysis on 7-3-2023 - Buy over 1255 Closing

Indusind bank Cup Handle ChartThe indusind banm 1h chart cup-with handle pattern formation. 🤔 this is also in the rounding bottom. Now the most important thinge the price is not cross the Pre-Covid High.
Follow for more intersting chart

INDUSIND BANK BREAKOUTDisclaimer- The risk of loss in trading stock, future,forex and option is substantial and losses may exceed initial investments. Past performance,wherther actual or simulated, is not indicative of future results. By viewing this video you agree that decision to purchase or sell any financial product is the sole responsibility of the person initiating such a transaction, specifically you. and Wealth Depth or this Youtuber is not responsible for your decisions or their consequences. This Video is for educational purpose only.
Thank You...😊

#INDUSINDBNK. looking good #INDUSINDBNK...
Intraday as well as swing trade
All levels given in charts
IF good potential seen then we work in options also
if activate then possible a huge movement Keep eye on this
We take trade only when it activates...


A reversal candlestick patternA Hammer candlestick pattern is spotted on daily timeframe near the support line of the stock which indicates Trend reversal for the stock.

Short Indus Ind BankHas broken lower trendline on 15 min time frame; target of 3 % in 2 weeks on the downside.

INDUSIND ! buy above 1168.30
dont do anythig if it falls below 1138.35
if it's passing time and moving around between 1168.30 and 1138.35, short strangle is a good position to take. The following day
or when it breaks 2 day high or low, exit the unnecessary option. We are in uptrend, could go sideway. Take the trade based on price action.

INDUSINDBKIn the Weekly Chart of INDUSINDBK,
we can see that, it took a huge bounce back from 1000 level.
Also, we can see a Cup and Handle Failure in INDUSINDBK.
Let it close above line with volume.
Enter with SL for above targets.

Indusind bank entering the channel again
After 4 months trading in range, Indusind bank broke down the range last week. Now it has started rising and entered the same channel again.
It is showing positive sign against EMA200 and Supertrend . I think with this setup , it has potential to go up in the coming days until it hits the middle line ( around Rs. 1200) in the channel and then upper bound.
Follow up for INDUSINDBK analysis on a lower TFINDUSINDBK also retracing back to fib 50% and RSI 60 on hourly TF. Find trades accordingly.

INDUSINDBK On a downtrend ??$INDUSINDBK might already be on its way to resume the downtrend. Script is currently facing resistance on the previous support and RSI 60 (I take RSI 60 and 40 as dynamic support & resistance thresholds). Also, 20 & 50 SMA have had a bearish crossover.

INDUSIND BANK short viewIndusind Bank as reversed from resistance zone, and as the market has also started to fall we can expect it to at least touch till 1150 levels.
Risk to reward ratio is 1:1 and if it falls below the support zone, it can also reach till 1000 levels.
Trade safe. Manage risk. Be profitable.
Please follow us for more simple trading analysis and setups. Also let me know in the comment in case you have any queries.
Disclaimer :- This is just my view. Please analyze charts yourself and then decide to take any trades.

BUY INDUSIND BANKIndusInd bank Q3 net interest income grew by 18.5% YoY to Rs. 4,495 Crore for the quarter. IndusInd bank reported a massive 68.7% year on year jump in standaloan profit at 1959 crore for quarter ended December FY23, and it's trading At 1211 now buy from this level, keep a stop loss at 1180 and hold for target 1264/1280+,,stock can rally after breakout from uptrend channel going on.
Please guy's like and follow me if you like my work.
thankyou.

IndusInd Bank Positional View Weekly Analysis @ 10-01-2023IndusInd Bank ready for a Breakout in Weekly Time Frame
Important Levels are Marked on Chart
I Shared what i Seen in Chart, hope this helps You in Learning,
Thank You Universe 🙏🙏🙏💐, Thanks to all my Teachers....🙏🙏🙏💐

Indusindbank appears to be interesting at pivotAfter volume activity Indusindbank looks interesting at pivot.

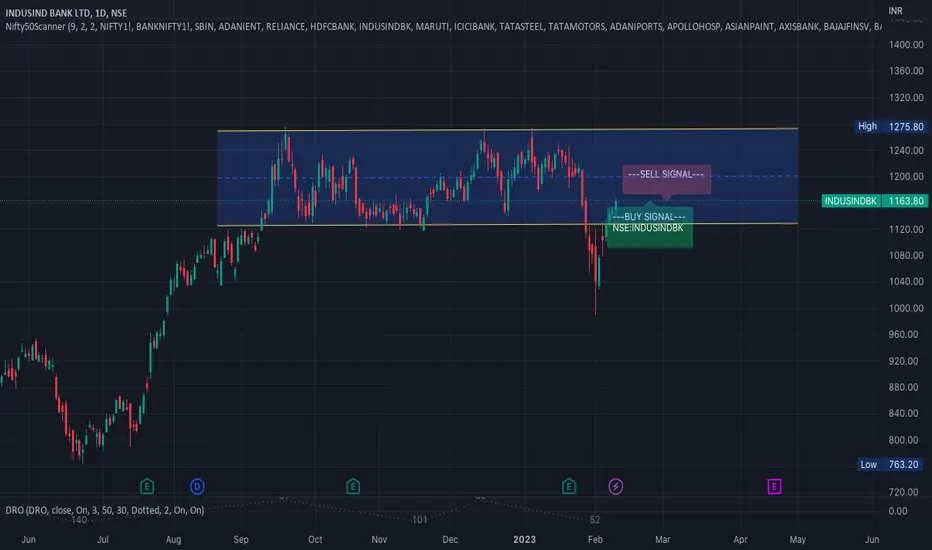
INDUSINDBK : Stuck between levels INDUSINDBK:
Daily TF : stuck between daily support resistance. good opportunity to buy near support & sell near resistance with small SL. you can have good R:R.
Hourly : in hourly time frame, its rejected from today's High and now coming down. still its showing HH & HL hence last resistance marked in RED is very important if its need to sustain. If it broke hourly support, it can go till Daily support and could be buying opportunity.
Always follow candle stick pattern near support & resistance.
Like, Share, Comment for regular updates.
Disclaimer
I am not sebi registered analyst
My studies are Educational purpose only
Please consult with your Financial advisor before trading or investing
