IRCTC - READY TO SWING WITH 1:2 RREverything is pretty much explained in the picture itself.
I am Abhishek Srivastava | SEBI-Certified Research and Equity Derivative Analyst from Delhi with 4+ years of experience.
I focus on simplifying equity markets through technical analysis. On Trading View, I share easy-to-understand insights to help traders and investors make better decisions.
Kindly check my older shared stock results on my profile to make a firm decision to invest in this.
Kindly dm for further assistance it is for free just for this stock.
Thank you and invest wisely.
IRCTC trade ideas

Indian Railway Catering & Tourism Corporation LtdStructure break in this stock with good volume now we can some good momentum

IRCTC BuyIRCTC jumped up from its trend line. Also its break above a triangle pattern. Buy @CMP (785) with a SL of 740 for a target of 815 and 855.

IRCTC🎯 Trade Plan Summary
Trade Type: BUY
Entry: ₹723
Stop Loss (SL): ₹706
Target: ₹1206
Risk: ₹17
Reward: ₹483
Risk-Reward Ratio (RRR): 28.4
Last Swing High: ₹1138
Last Swing Low: ₹655
✅ Analysis & Commentary
Trend Confirmation: All timeframes (from Yearly to 60 Min) are in an uptrend, which confirms trend alignment and adds confidence to the bullish bias.
Entry Zone Validity: ₹723 is around the ITF average and aligns with Monthly SWAP and BUFL logic on lower timeframes—solid zone to enter.
🔍 Multi-Timeframe Trend Summary
Timeframe Trend Zone/Logic Proximal Distal Avg. Support
Yearly UP Support & Resistance 916 557 737
Half-Yearly UP DMIP 775 557 666
Quarterly UP DMIP/BUFL 775 557 666
Monthly UP SWAP 720 649 685
Weekly UP DMIP 774 706 740
Daily UP DMIP/BUFL 775 757 766
Intraday (60–240M) UP BUFL 723 706 715
SL Placement: ₹706 is close to the distal levels of multiple timeframes (Daily, Weekly, and ITF), making it a structurally valid stop loss.
Reward Potential: Target of ₹1206 sits above the previous high (₹1138), which indicates breakout expectation. Make sure there is no heavy resistance between ₹1138–₹1206.
RRR: At 28.4, this is an excellent reward-risk setup. Even if partial profits are taken at the previous high, the trade remains lucrative.
⚠️ Watchouts
Volume Confirmation: Ensure volume supports the move near 723–730. A breakout from this zone should be backed by strong volume.
Trailing SL Strategy: Consider moving SL to breakeven once price crosses ₹775 or ₹800 to reduce downside risk.
Macro Events: Be aware of any IRCTC-specific news (government announcements, earnings, etc.) that might cause volatility.
📌 Final Verdict:
This is a high-conviction buy setup with strong multi-timeframe alignment, a tight SL, and an exceptionally favorable RRR. Monitor price action around ₹723–730 closely for entry confirmation, especially on the 60M chart.

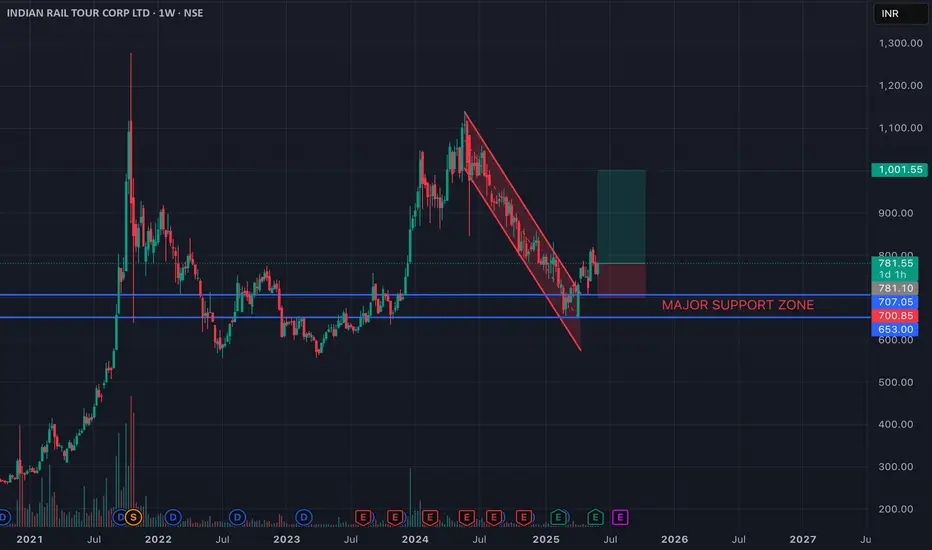
IRCTC IN RANGEAfter a long downtrend the stock has taken a major support @700-710 levels
The stock look good from both technical and fundamental standpoint
I've entered the stock @780
Target - 1000+
Sl - 705 WCB(weekly closing basis)
If u like my analysis plz follow...
Indian Rail Tour Corp Ltd view for Intraday 28th May #IRCTC Indian Rail Tour Corp Ltd view for Intraday 28th May #IRCTC
Resistance 800 Watching above 802 for upside momentum.
Support area 780 Below 790 ignoring upside momentum for intraday
Watching below 778 for downside movement...
Above 790 ignoring downside move for intraday
Charts for Educational purposes only.
Please follow strict stop loss and risk reward if you follow the level.
Thanks,
V Trade Point

Possible Swing Trade in IRCTC1. Good volumes
2. MACD Signal turned green
3. RSI crossing above 50
4. Stock returning after forming a base at 78.6% retracement
5. Good weekly close
6. Risk - Reward is more than 2

IRCTC:Likely EMA CROSSOVER AND BREAKOUTIRCTC:Trading above all its DEMAs Viz 20,50,100&200DEMA.Moreover Golden Cross over of 20DEMA Vs other DEMAs and increase in volume suggests,holding above 810 on closing basis suggests a move towards 830-850(For educational purpose only)

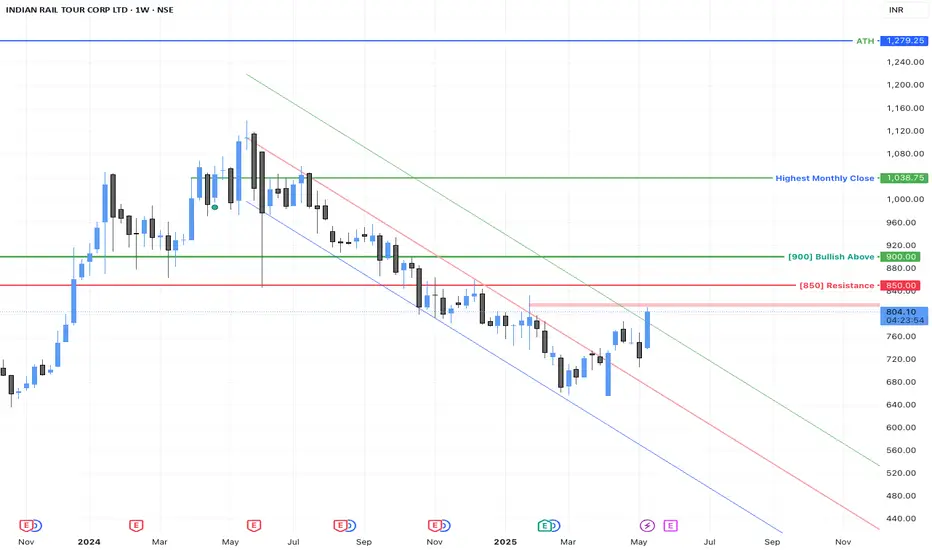
IRCTC Weekly ChartIRCTC weekly chart confirmed a breakout from the channel it was trading for the last one year.
Short term resistance around 815.
Look for signs of reversal near 850.
The stock will turn bullish only after a strong close above 900 (will small investors get a chance here?). After 900, target is only upto 1000 - if the stock needs to move higher, it needs to consolidate for few months.
Disclaimer: Only for educational purpose - not a buy / sell recommendation.
IRCTCStock trading near 200 (ema + dma) and horizontal support line with Fibonacci retracment level so, we can expect reversal towards upwards


IRCTC - BULLISH ACTIVEIRCTC - Indian Railway Ctrng nd Trsm Corp Ltd - BUY ACTIVE
Chart Insights : Day Chart
Stock closed at 754 on 15-Apr-25
We can see stock breaks the channel pattern with good volume and can expect upside move if its sustain above the resistance.

IRCTC long on Pullback strategy IRCTC correction wave might pause near 0.618 level
looking for long opportunity with a Stoploss of 720

IRCTC - Forming Cypher / Shark IRCTC - Forming Cypher / Shark it has potential to to go to below levels.
765 / 740 / 693 / 660

IRCTC:Likely Price & Volume Break OutIRCTC: Trading above its 20& 50DEMA,price solid bullish candle formation ,price volume action suggests its is at the verge of giving a Neck line break out above 806-810 Band.In the event of a break out likely to test 840-860 Band soon(For educational purpose only)

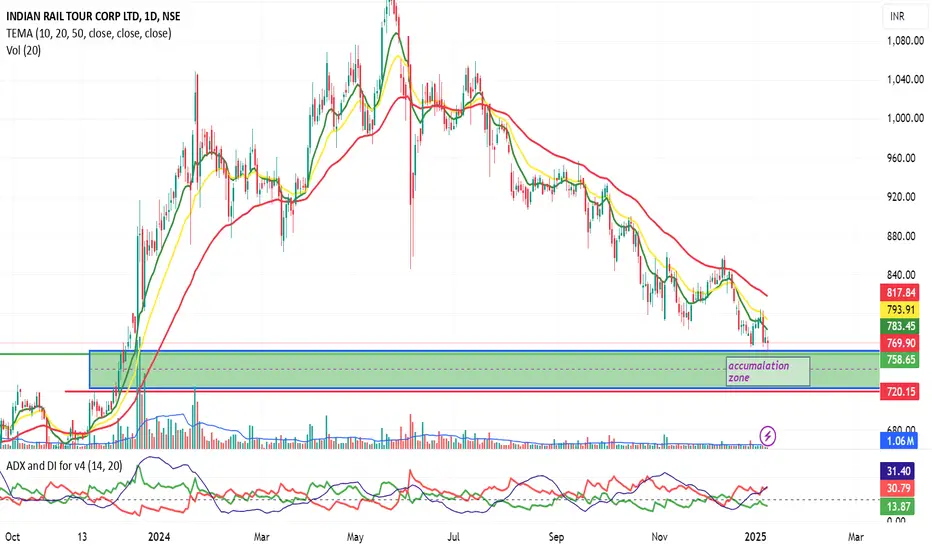
IRCTC Reaches Multi-Year Support – Should You Buy Now...?IRCTC has recently approached a significant multi-year support level at 768. This level has proven to be a reliable support point in both 2020 and 2023, indicating its importance for investors and traders alike. Currently, although we are observing a short-term downtrend in the stock's price, there is a potential turning point in sight.
If the price manages to break above the established trendline and maintains that elevated position, it could signal a promising buying opportunity. This scenario would be reinforced by two key confirmations: first, the reaffirmation of the multi-year support at 768, which historically has provided a cushion against further declines; and second, the breakout above the trendline, suggesting a potential shift in momentum. Thus, careful monitoring of these levels may provide strategic entry points for investment.

IRCTC NSE:IRCTC
GOOD STOCK OF LONG TERM
ACCUMATAE on dip
Can buy @CMP
Add till 730-725
Sl- 718-15
Target- 800/856++
Fundadental is strong and mpnopoly stock.
IRCTC will rock due to Kumbh Mela Travelling this quaterIRCTC price looks attractive and at support zone to push minimum 100 points up

IRCTC at Key Support Level Since its inception, the IRCTC stock has consistently bounced off a trendline (TL) support. Currently, it has reached the same trendline and seems to be taking support again. Additionally, the previous supply zone around the **₹750-₹780 price range** has now turned into a demand zone. This presents a **good buying opportunity**, as the stock is showing signs of strength at this critical level.

This Stock Price Trading Near Multiyear SupportAfter a Strong corrections finally price trading near multiyear support ( low risk zone for any stocks) . So we may take some risk for upside .

IRCTC - Potential Bullish ReversalIRCTC - Potential Bullish Reversal with Elliott Wave Setup
Key Levels and Zones :
Current Price: ₹777.25 (-₹3.15, -0.40%)
Support and Buying Zones:
Wave C Completion Zone: ₹762.00 - ₹788.00
Extended Retracement Zone (Liquidity): Below ₹762.00
Target Zone: ₹978 - ₹1,008
Stop Loss: ₹728.80
Chart Analysis :
Wave Patterns: The daily chart illustrates an Elliott Wave correction pattern with the following structure:
Wave A: Initial decline signaling a bearish move.
Wave B: Temporary corrective upward move.
Wave C: Indicates a potential bullish reversal in the zone ₹762.00 - ₹788.00.
Change of Character (CHoCH): ₹815.75 acts as a key level for a potential sentiment shift if broken.
Support and Resistance Levels:
Support: Green zone (₹762.00 - ₹788.00).
Resistance: Descending trendline and target zone (₹978 - ₹1,008).
Trade Plan :
Entry Point:
Long positions can be initiated within the Wave C completion zone (₹762.00 - ₹788.00).
Targets:
Primary Target Zone: ₹978 - ₹1,008.
Stop Loss: ₹728.80 to mitigate downside risk.
Conclusion :
IRCTC’s daily chart reveals critical support and resistance levels, presenting traders with a structured trading opportunity based on Elliott Wave theory. By closely monitoring the Wave C completion zone and CHoCH level, traders can position themselves for potential bullish momentum with a favorable risk-reward ratio.
Disclaimer: This analysis is for educational purposes only and does not constitute financial advice. Always perform your analysis or consult a financial advisor before making investment decisions.
#IRCTC #TradingPlan #ElliottWave #TechnicalAnalysis #StockMarket

IRCTCIRCTC
MTF Analysis
IRCTCYearly Demand 775
IRCTC 6 Month Demand 775
IRCTCQtrly Demand BUFL 775
IRCTCMonthly Demand 621
IRCTCWeekly Demand 710
IRCTCWeekly Supply 1088
IRCTCDaily Demand DMIP 727
ENTRY -1 Long 727
SL 692
RISK 35
Target as per Entry 887
RR 5
Positional Target 1385
Target Points 160
Recent High 1,049
Recent Low 720

IRCTC Long trade strategy
Bouncing back from its important support can expect an target all time high price
If falls below the current levels can expect support in simultaneous support trend line
Also wait for bullish reversal signs near these support levels before entering a trade
Cheers happy trading!
disclaimer- this is not any investment call or idea , this just my view and it can go wrong ,this is only for educational purposes trade at your own risk
