IRCTC trade ideas

IRCTC - Getting into long consolidationIRCTC - Getting into a long consolidation. All depends on when they open up Rail services. Can be accumulated till 1210..! Wait for announcement, it will blast. Above 1450 it will can re test its earliers levels too..!


IRCTC : On support level, can see bounce backIRCTC hit the critical support line. We can see bounce back.

IRCTC MAKE OR BREAKNARROW RANGE IRCTC
DAILY TRENDLINE RESISTANCE
HORIZONTAL LINES ARE SUPPORT AND RESISTANCE


#IRCTC1270 a good buying area for IRCTC, should wait for it, for short term trade to long term trade not for intraday.

IRCTC - 79.3% UP in Net profit - bounce back from Demand zone#IRCTC results Q4FY20 Net profit up 79.3% at Rs. 150.6 cr and Stock is treading near to supply zone and got positive volume in last treading session. Current, stock is treading in narrow range and closed above 20EMA. RSI break the resistance trendline and moving UP.
Price Range 1481-1502 >>>>>> Supply zone and Strong resistance
Price Range 1338-1350 >>>>>> 1st Demand Zone and Strong support
Price Range 1238-1247 >>>>>> 2nd Demand Zone and 2nd support
Price Range 1180-1190 >>>>>> 3rd Demand Zone and 3rd support
Showing Bullish in Technical Parameter:
CCI is treading UP
RSI is treading UP
MFI is treading UP
----------------------------------------------------------
Support : 1361 and 1350
Breakdown : 1381
CMP : 1401
Breakout : 1443
Short Target : 1485 and 1502
----------------------------------------------------------
Positive & Negative Point:
1) Bullish in Daily/weekly/Monthly chart.
2) Stock underperforming from Benchmark and sectrol index on 1 week and 3 month both
----------------------------------------------------------
(Disclaimer: This is only for educational purpose.)


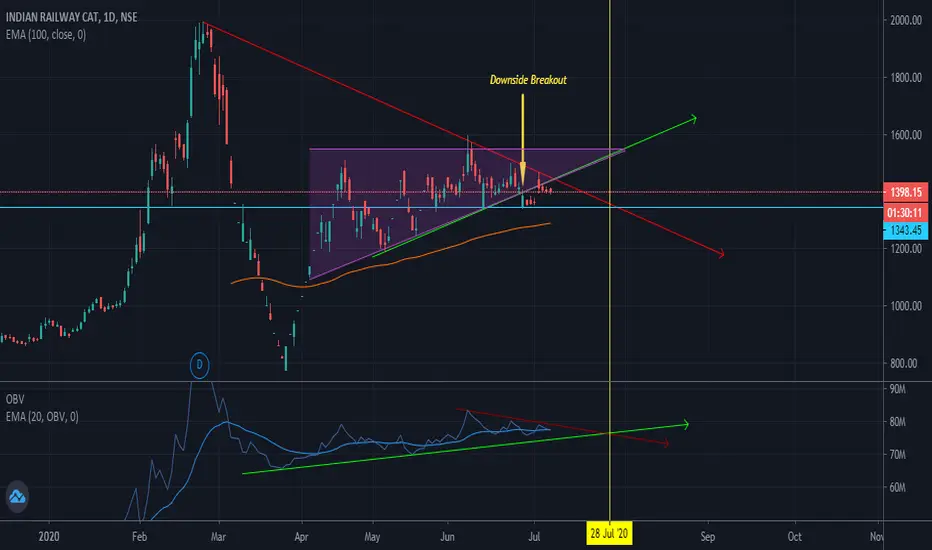
IRCTC LongI am a novice in markets, Feel free to correct me.
Tools: Trend Line, OBV WITH 20EMA & Prices with triangle and 100EMA
Observation: IRCTC had a pricegap on 26th june as results were postponed plus nifty`s volatility. Therefore the support line which it was holding on from 7th may, finally broke on 26th june. Then it was range bound between 1340-1440, so it has pressure to break either of the limits before july end.
OBV hasnt shown anydivergence yet and trending along with 20EMA, so not indication there for any side.
Still it is important that it is in subtle upward trend(not sharp) since last several months, both in prices and volume & no major change in fundamentals has been seen since then.
Now as you can see there was a crossover of uptrend and downtrend on 25th june which it didint sustained and moved with major downtrend continued from Rs.1950 & fell, again there is a crossover of major dowtrend from 1950 to uptrend from 1109 at july end.
which raises an opportunity as stock is trading above 100 ema and obv is in uptrend since march, both sugests bullishness.
Conclusion: If it breaks 1340 it will be pulled back toward 100 ema or if it breaks 1440 upside can be seen upto 1550.
Healthy criticism is most welcome.

IRCTC looks bullishIRCTC has formed a bullish pennant pattern , Target 1720 , 1900 as mention in the chart with SL of 1370
for learning : Pennants, which are similar to flags in terms of structure, have converging trend lines during their consolidation period and last from one to three weeks. The volume at each period of the pennant is also important.

IRCTC DO TRAINS FLY ?Follow up on previous chart just lower time frame
Classic breakout then retest of blue dotted line at 1509 doubt it will dip below here but the other 2 MA's bringing up the rear end at 1456

IRCTC | Don't underestimate it
IRCTC has been consolidating in a pennant right under the resistance for about 2 months now.
Just broke out of it today, im long IRCTC until it hits 2000. Not selling before that.
Think about it, the Railways are yet to operate in full capacity after lockdown is phased out slowly. Definitely i would expect this piece of art to boost up once the economy is unphased.
DONT MISS IT!
Leave a like if you like my charts, it encourages me to publish more charts to the public. Thank you.

IRCTC - Breaking out of PennantIRCTC is on verge of breaking out of the pennant . with lockdown lifted , things should only go better for this stock

Breakout point is approaching !!! The trend is going in accomodating. Possible breakout in an uptrend.

IRCTC - Lesser carbon footprint Demand should increase.21 day offering support on the daily
Looks like this is on a steep incline trending up so do not rule out 1963 coming fast . Air Travel looks slightly depressing for the time being however trains i feel will be the backbone .
Don't really dwell too much on the FA however waiting for 1450-1509 to get blasted through then we have a nice big Zone with barely any resistance.
Might just be aggressive and fomo in with a tight SL at 1368.95 depending on price action when it opens.
You've gotta be in it to win it ...in'it?

Flag Pattern IRCTC daily chartBullish Flag Pattern spotted. Volume needed for breakout. Target price 2170.Best buy time as it is in consolidation phase.


IRCTC - Even the Chart is Following Social Distancing normsIRCTC - Strictly following the Social Ditstancing norms

IRCTCI have done this research based on the Monthly, Weekly and Daily charts.
I never like to take my trade on less than a daily time frame and I advise those who like to hold their trade for more than 1 to 3 days. Then please do not take your trade basis on the lower time frame.
If you like my idea then do like it and if you have your idea or research you want to share then do it I would love here about it!
Happy trading!


