ITC going down?Price making higher highs with RSI making lower lows. ITC looks to have topped at 290 levels. At the current level of 270, DMI has a bearish crossover, indicating an increasing strength of bears. Next support level at 260
Quick short trade
Sell - 370
Stop Loss - 374
Target - 360
ITC trade ideas

ITC | Bullish consolidation
ITC has been on a bullish trajectory since the beginning of 2022 and is currently consolidating in a triangle. Price is continuously forming higher highs and higher lows and is trading above 50 and 200 DMA. Breakout above this congestion zone and sustenance at 395 will be an opportunity for the stock to steer to new highs.

ITC STOCK LOOKING GOOD FOR SHORT TERMAs on Chart Analysis ITC can make new High @ 425 in coming few days
it can move from 395 to 412,425
only for education purpose....

ITC Ltd 02.04.2023ITC looks strong for short term. As per chart analysis ITC may achieve 386 and 393 on short term basis. Stop loss seems clear at 377.85.

ITCEstablished in 1910, ITC is the largest cigarette manufacturer and seller in the country. ITC operates in five business segments at present — FMCG Cigarettes, FMCG Others, Hotels, Paperboards, Paper and Packaging, and Agri Business.
Observed Exhaustion , May correct in coming days
Levels Expected - 356 - 360
This short call expires / negated once RSI breaks the upper limit ( 70 to 80)

ITC
Open
244.00
Previous Close
242.50
UC Limit
266.75
LC Limit
218.25
Volume
24,823,291
VWAP
240.26
Mkt Cap (Rs. Cr.)
293,778
20D Avg Volume
33,726,752
20D Avg Delivery
12,283,897
Beta
0.72
Face Value
1
TTM EPS
11.30
TTM PE
21.10
Sector PE
22.78
Book Value Per Share
47.88
P/B
4.99
Dividend Yield
4.51
P/C
18.86


ITC Breakout ITC at very crucial Level. the stock maybe break the resistance or take rejection from the resistance.
Add this stock in your watchlist
Make sure do your own analysis first

ITC 15M (23 MARCH 2023))NSE:ITC
itc given a breakout it may be fake one like previous so we can wait.
after retracement can go target will be 381.70.
otherside can go again downside
as before which is exact the resistance level.

Trend Reversal After Impulse - Short After Impulse:
Formation Of Ending Diagonal
2-4 Trendline not yet broken.
Probable targets before mid of Apr
Target 1- 368
Target 2 - 360
Disclaimer :
It is not any recommendation. Only for educational purposes. This is my personal view only.

ITC BearishITC looks bearish in short term. It has multiple confluences
1. Double top at 394 levels
2. Generally Fibonacci retracement of this stock has been observed till 0.382 levels, which are yet to appear.
3. Tight Downward channel.
Fresh shorts can be initiated here for target 366,360, 355, 325. SL 384

ITCITC
CMP 376 ...
EW Counting of ITC from March 2020
looking at the structure ... wave (3) has been completed and we are heading for wave (4)
which could make price go towards 310 levels ...
it can slide further depending on structure but one can expect 310 from this price to come ..
Just a View!!
Vedang :)
Chart is for study purpose only!!

Decending triangle pattern The chart pattern indicates that making price from high to lower highs at resistance levels and making equal lows at support so that chart indicates that price shortly will fall. Target-174 and stop loss -214. this is educational analysis and is not for any buy or sell call

ITC breakout finally?ITC has given a weekly closing above its supply zone of 260-265 after 3 years also breaking its previous 52 week high with very heavy volumes.
From the chart, it is clearly visible it is an inverted head and shoulder pattern and stock has given closing above its neckline.
Let's see whether it sustains the breakout and bring happy faces on many investors' face;)

Small term trade in ITC Inside barSmall-term trade in ITC Inside bar
Bullish
MTM: 384
Target: 397
SL: 373

ITC LTD wweekly breakout hai strong bullish Dip buyHi everyone please consider this stock for uptrend every dip buy 4 hour chart

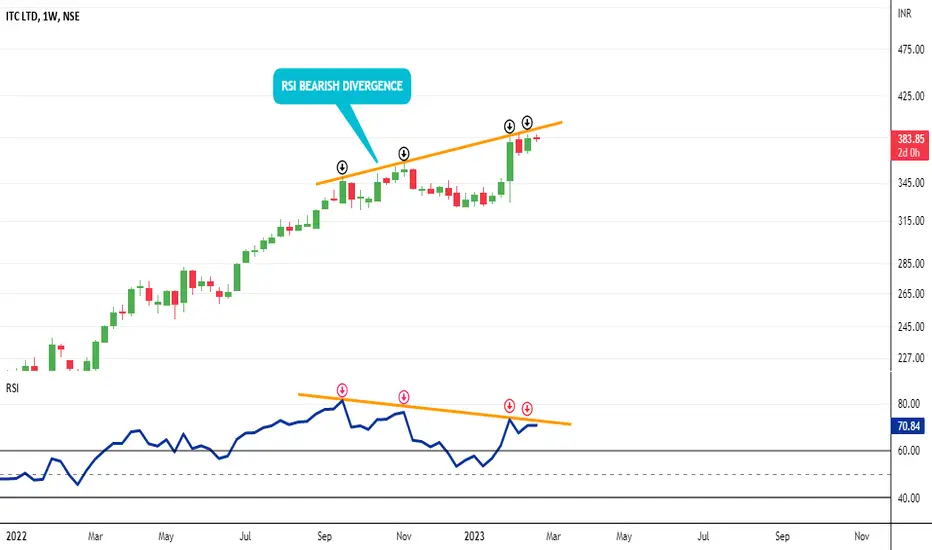
RSI BEARISH DIVERGENCE ON WEEKLY & DAILY CHART. Hello to everyone,
As we can see there is a bearish divergence in RSI & PRICE on weekly & daily timeframe. This is indicating that price has not much momentum to go upside. We can expect a trend reversal in stock price but only RSI divergence does not confirms the trend reversal. If any bearish candle or bearish pattern forms than only we can go for the short position.
Traders, if you liked this thread , write in the comments. I will be glad.
Attaching previous idea of ITC
BUY ITC FOR TARGET OF 360The stock has risen above the falling channel on the daily and weekly chart, suggesting increasing bullishness. Besides, the stock price has moved above the 50 day exponential moving average on the daily timeframe. The MACD indicator also suggesting bullish crossover in ITC .. Stock kam se kam previous high pe to jana chahie jo ki 360 ka hai,,lower side bat kre to 325-330 pe acha support hai,,to buy kro and paisa kamao, vaise bta du ye stock long term k lie bhi best hai...to jaisa chaho vaisa kr skte ho,
PLease like and follow me for future updates.
Thankyou.

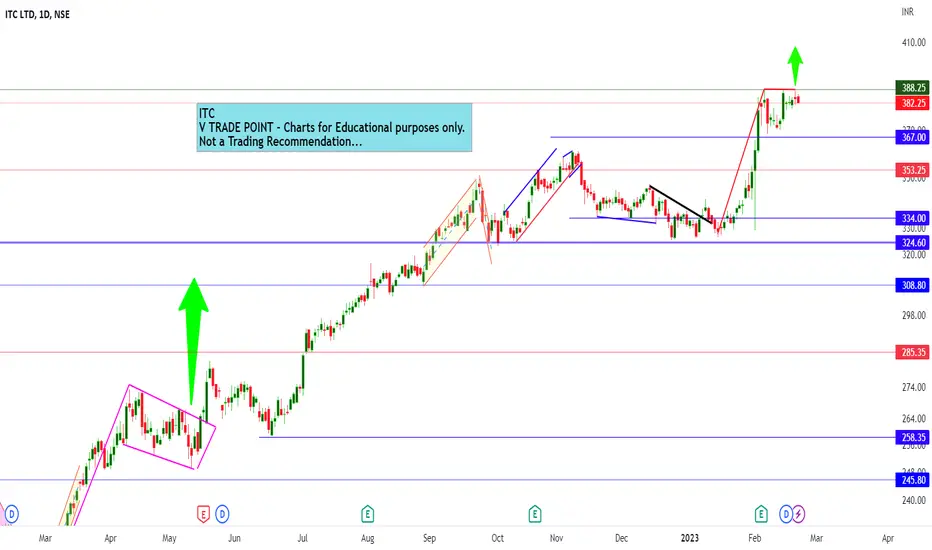
ITC ATH 388.20 - Breakout expectationITC ATH 388.20
Above sustain then more chance for upside
Charts for Educational purposes only.
Please follow strict risk reward and stop loss if you follow my level
Thanks,
V Trade Point
Double top pattern showing bear Can you tell me. Is this double top pattern..?
ITC Ltd formed a good pattern.
Also this stock is at high price..
Wait for support....

Here is a possibility to get a buy signal in ITC Stock.If the price crosses the resistance line then you can buy. and stop loss will be the resistance.

ITC Looking WeakITC Looking Weak on Daily Time Frame It is Trying To Form M Pattern We Can See A Good Down Side From Current Level As Stock is Already Rallied Much And Ex-Dividend Date is Also Gone So We Can See A Good Profit Booking in ITC.

ITC ATH Breakout expectationITC ATH Breakout expectation
Please follow strict risk reward and stop loss...
Charts for Educaitonal purposes only.
Thanks,
V Trade Point
