ITC CONSOLIDATIONITC has hit its 5-year resistance at 262 and got a strong rejection there keeping it in the rising wedge. There are now chances for it to consolidate between the 5-year resistance line and the rising slope having a breakout point around June to July 2022.
ITC trade ideas

ITC Buy @INR207 - another 7% decline from now.
Upward channel with not-long-enough and not-short-enough time frame since the formation of channel.

ITCMust Correlate yourself on charts before taking an entry. This is for Educational purposes only. Please consult your Financial advisor before investing.

A Symitrical Triangle FormedA symmetrical triangle formed accumlate in between 200 to 225 in SIP mode for the Targets of 375+ And make a sl of 198.

ITC - head and shoulder patternITC :
Sell Nov 230 CE @10/ above
Buy Nov 230 PE @7/8
Sell Nov fut @230, Target - 210
Insurance - Buy 230CE @10

ItcThis is your up@down side level but if your trade this stock i tell you clearly plz manage your RR
ITC is a Gem following the Technical and Fibonacci I have been tracking the ITC for some time ,Every move is exactly based on the Key Fibonacci Extension and Retracement levels of 38.2,50,61.8 ,In the last two down move it placed a support exactly at the key FIB level and started moving.
I see this move lead to 248 to 250 levels first before it makes any correction again.


ITC - Last level , that could save ITCWe have witnessed a remarkable move in the ITC from 200 levels to 265 levels 😍 in the past few months.
Though in the last week, it has fallen about 12 %, that's a huge number 😲, ideally which an up-trending stock should not witness.
Though it has good support around 230-232 levels, if held, then chances of moving upwards would still be there on the cards 😀.
Moving below or close below these would make this stock laggard 🤨 again. then it would most likely trade between 230- 218 levels.

ITC ON FIRECurrently ITC forming double bottom pattern. If ITC break 250 level n sustainable then it's a very Bullish sign. IMO this is the right time to go long in ITC. ITC consolidate in between 200 to 225 level from last 9 month and currently 265 is the breakout. But at the top level accumulation zone forming and after it's completed we can see min 300 also 400 levels.


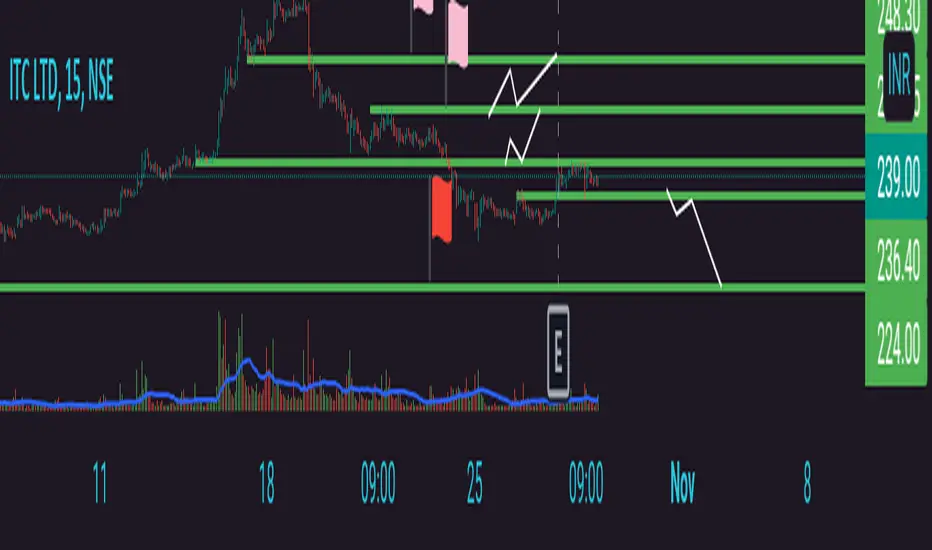
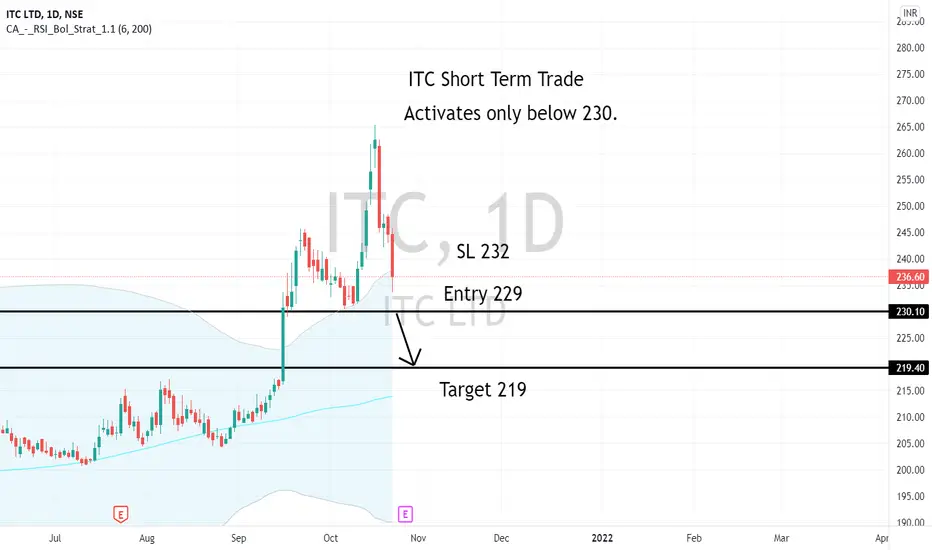
ITCITC is looking to complete M Pattern in Daily Timeframe.
But we should wait for 230 to break before jump in.
Below 230 it will go to 219.
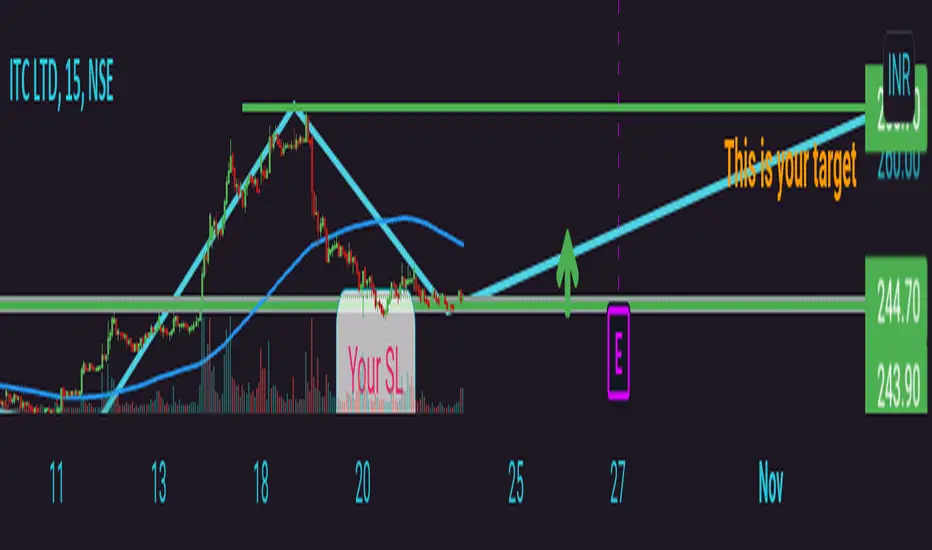
ITCPosition bana rkha hai HH HL, results acche aye to 300++ jayega. support 242 ka hai Buy 245 - sell 241


ITCThis is your time to trade your brother is here u buy itc the price is going up HH HL your Sl 242.30 your target is 268.70
ITC in a bullish Wave 4; Target 278ITC is getting tighter and tighter. Above all the EMAs. Major support at 198, resistance at 251; Upward trend line from March lows getting closer. We are in Wave 4 of a classic Elliot wave pattern. Notice that the lengths of waves 1 & 3 are the same & both took around 100 days to form. Wave 2 was an exact 61.8% retracement of Wave 1. Wave 5 target of 278, ideally around Q1 2022
Target: 278
Stop Loss:198

Broken Symmetrical TriangleStock Analysis: ITC has broken the sym triangle as long as not closing the immediate demand zone expected target marked on the chart.
let's see..

ITC - SELLLike & Follow
Happy Trading
ITC - Sell
Negative - Daily & Weekly chart
MACD - Negative
RSI - 44 downtrend
Support Levels - 217
1st Target - 225 if the target breaks
Next target - 217

The Evergreen ITC PuzzleNSE:ITC is probably one of the most talked about stock in Indian markets. Twitter is full of ITC memes and investors have grown old hoping that one day ITC would finally start making a decisive upmove for good :)
Anyhow, if you see the volumes in ITC lately, there has been a lot of interest. Lots of large volume bars in recent few weeks and the stock has broken out of a falling trendline (as shown by arrow). There are still some near term resistances as you can see in chart but could this breakout be the move that everyone has been waiting for? Only time will tell.

ITC 1 Hour ChartWait for a Breakout and Take Position Target will be previous support or resistance !
ITC 30 Min Chart Descending Triangle Breakout 12 Oct 2021ITC 30 Min Chart Descending Triangle gave a Breakout 12 Oct 2021


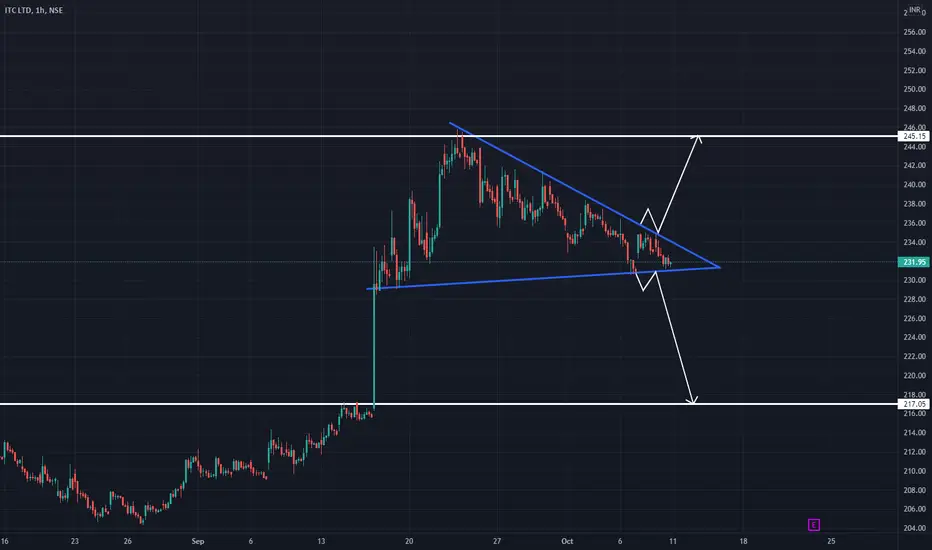
ITC - Trendline BreakoutIn today's session, ITC broke the trendline, it had been resisting for the past 20 trading sessions.
Now if it sustains 232 levels in the short-term, it probably giving clues of renewing its long-term trend .
Immediate resistance 237-238
Further resistance at 244
Support 230
