ITC trade ideas

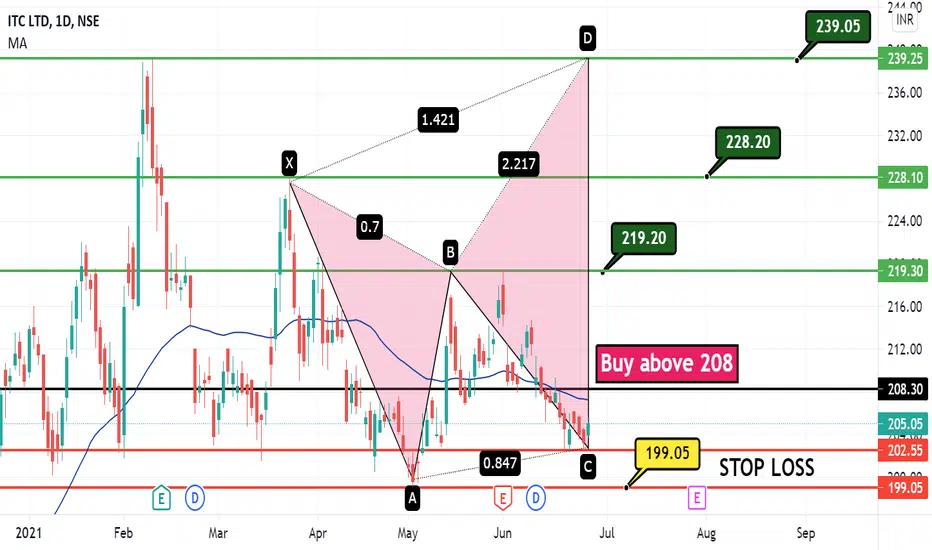
elephant is likely to move noweverything is in the chart. in the past it has rallied after the buying exhaustion in nifty. seems this time it might play similar. Still doubt is there as a bearish gartley in weekly view is also forming, but even if in that case c leg has the target of 230. So, a 10 % target with 3% stoploss will be a good strategy from a buyers point of view.

ITC CALL 2 DAYSStop loss will be 200 fixed for long 5-7days.
but when it's retest then stoploss will below 5 candle.
If retest fail but on downline with stoploss of 200.


ITC LONG ABOVE 207PRICE IS AT MAJOR SUPPORT, AND IMMEDIATE RESISTANCE AT 207. IF IT BREAKS 207 THEN IT MAY BE A GOOD BUY WITH GOOD RR RATIO.


ITCTarget. 268/300+
investment purpose 3/6/9 month
*Educational purpose Do your own analysis before investing*

ITC @226ITC. DAILY CHART SHOW BULL SIGN PRICE MOVE UP COMING DAYS CLEAR FORMED CYPHER PATTEN 202 204 STRONG BUY POINT NEXT LEVEL 216 218 226 ....

ITC is going to riseNSE:ITC
*Trade Setup*
T1 - 230
T2 - 240
SL - 205
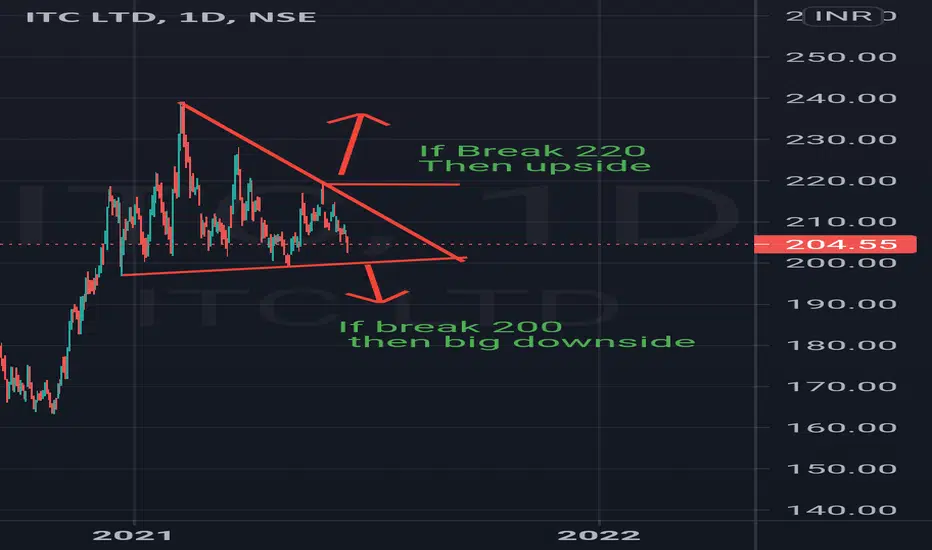
ITC has been trading in a range for a really long time.
200 remains to be a very strong support region and it has taken support over 5 times.
It has formed a triangle pattern so it has the potential to get out of that range and move higher.
Triangle pattern with 3 resistance is a good setup with high probability.
*Trade Confirmations*
- It has been trading in a consolidated range for a long time.
- Descending triangle pattern with 3 resistance is good.
- Volume is higher and it has crossed the average volume.
- Triangles are a really good patterns with high probability.
- Fundamentally good company.
Thank you for patiently viewing my ideas/analysis.
I appreciate it!
Let me know in the comments if you have any doubts or feedbacks


Broken flag patternITC updated chart perfectly on retracement levels, expect to reach 250+
let's see..


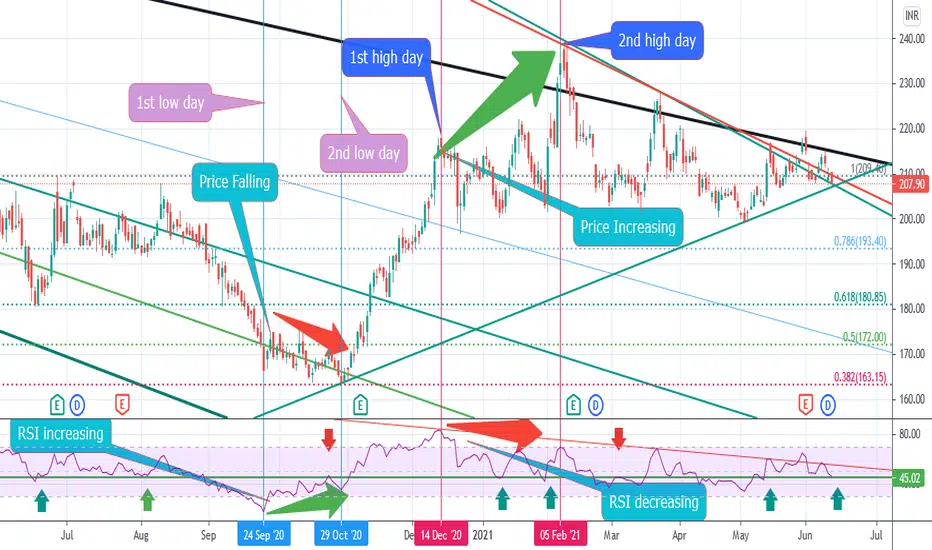
studying RSI divergancethis is a good example of rsi divergence and price action. If we can find in any underlying asset this kind of divergence, we can of course get a decent strategy with less psychological emotion.
itc seems a good investment stoploss should be 204 for intraday , 197 for weekly and 182 for monthly investors. targets will be 211 for intraday, 219 for weekly and 243 for monthly investors. once this stock gives a close above 225 in a weekly chart, real momentum can be seen.

Long ITC for 220,228,2401. Good for investment and will certainly give a good 40% returns in coming few months
2. Traders can look for 220 and 228 but if we get lucky this can become a flying beast in one da
There are lots of jokes about this script but if we really look into the averages of this stock, this stock is readying itself for a wonderful upside and will amaze everyone .
When I say that I am trading it, I am doing so with a closing basis stop loss of 205.

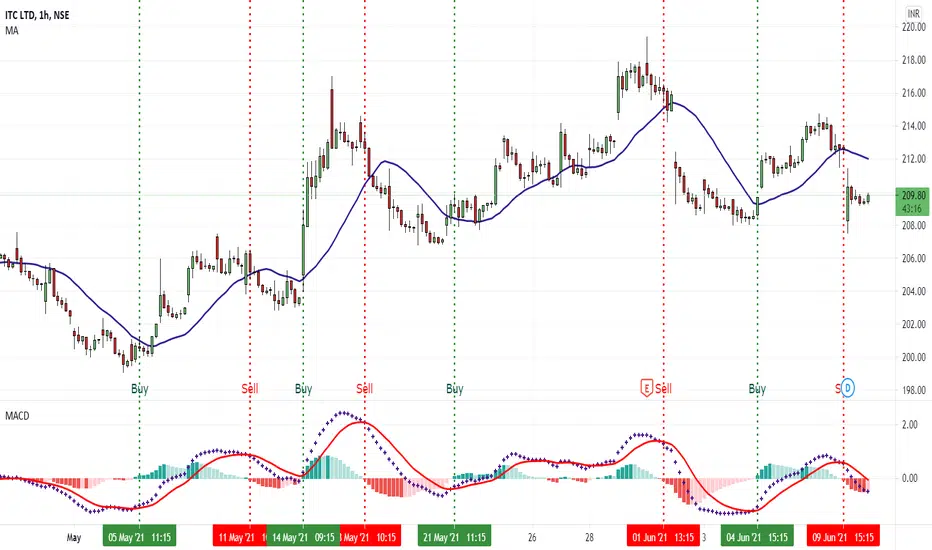
A Simple Trading System - ITCI am posting a simple trading system created by @JustNifty (Shri Van Illango).
I have fallen in love with this system.
Only ITC, MACD, 20 Moving average.
60 minute time frame
I will try this from Monday hopefully and post results too about this system.


Itc breaking outGuy itc is given a breakout in 4h and 1 day timeframes it has been consolidating for ages hope this time it will make new highs
