ITC ready To Flyy...Buy ITC at 420 or above 440...
Target1 - 499
Target2 - 548
Target3 - 605
Disclaimer :-
I am not SEBI registered. The information provided here is for education purposes only.
I will not be responsible for any of your profit/loss with this channel suggestions.
Consult your financial advisor before taking any decisions
ITC trade ideas

Darvas Box Strategy - Breakout StockDisclaimer: I am Not SEBI Registered adviser, please take advise from your financial adviser before investing in any stocks. Idea here shared is for education purpose only.
Stock has given break out. Buy above high. Keep this stock in watch list.
Buy above the High and do not forget to keep stop loss, best suitable for swing trading.
Target and Stop loss Shown on Chart. Risk to Reward Ratio/ Target Ratio 1:2.
Be Discipline, because discipline is the key to Success in Stock Market.
Trade what you See Not what you Think.

ITC Ltd view for Intraday 10th September #ITC ITC Ltd view for Intraday 10th September #ITC
Short term bulls if sustain above 500
Buying may witness above 513
Support area 500. Below ignoring buying momentum for intraday
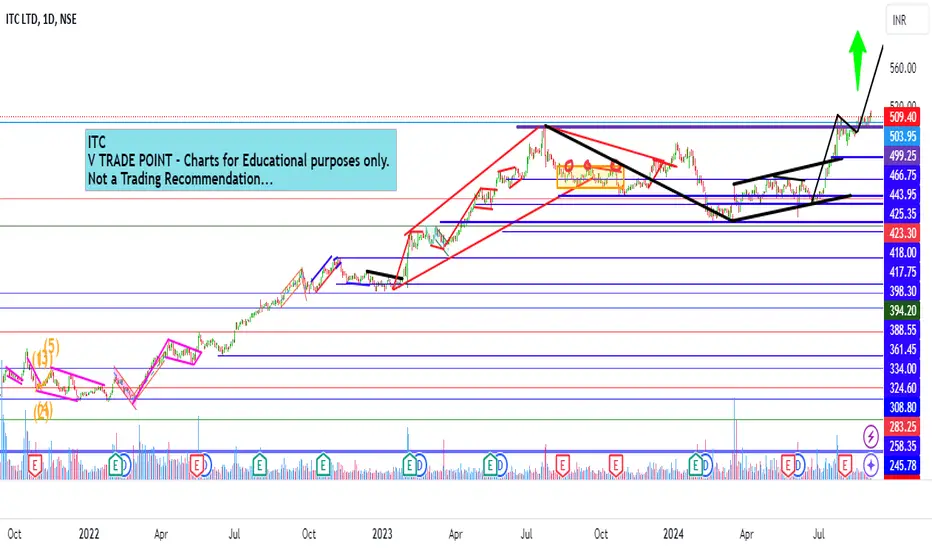
Charts for Educational purposes only.
Please follow strict stop loss and risk reward if you follow the level.
Thanks,
V Trade Point

Short term view for ITC Short term view for ITC
Bullish flag pattern if sustain above 500.
Target 580
Charts for Educational purposes only.
Please follow strict stop loss and risk reward if you follow the level.
Thanks,
V Trade Point
ITC: not too late to enterStructure and Market news both are bullish.
Stock has formed various bullish structures including VCP with volume drying up, its about one or two sessions when be see a major break through candle to the upper side.
Targets are mentioned in the chart.
PS: Not a SEBI registered broker.
Just sharing an idea for the prospective trade.

52 Week High Breakout Strategy - Positional Trade Long TermDisclaimer: I am Not SEBI Registered adviser, please take advise from your financial adviser before investing in any stocks. Idea here shared is for education purpose only.
Stock is near 52 week high break out. Buy above the High and do not forget to keep stop loss best suitable for Positional Trading long Term. Keep this stock in watch list.
Target and Stop loss Shown on Chart. Initial Target Ratio 1:2. Exit only if Stock Price Close below 30 SMA on Weekly Chart.
Be Discipline, because discipline is the key to Success in Stock Market.
Trade what you See Not what you Think.

itc chart analysisITC chart analysis on daily time frame. If it gives a breakout then we can expect a good move.
Please share your valuable feedback.

Itc for swingITC Ltd is a diversified conglomerate with a strong presence in FMCG, hotels, paperboards, packaging, and agribusiness. Positive momentum as the stock gains marginally today.

ITC Ltd intraday level for 22ND Aug #ITC ITC Ltd intraday level for 22ND Aug #ITC
Buying may witness above 507
Support area 500. Below ignoring buying momentum for intraday
Charts for Educational purposes only.
Please follow strict stop loss and risk reward if you follow the level.
Thanks,
V Trade Point

ITC | SWING | LONGPrice is showing high momentum.
Price is making base near ATH.
Volume activity is also really good.

ITC BREAKOUT Stay in Long PositionFirst Resistance:- 502.2
Second Resistance:- 505.7
Third Resistance:- 507.9
First Support:- 496.5
Second Support:- 494.3
Third Support:- 490.8
Daily Avg. Delivery Volume %
20 Aug, 2024 Week Month
57.0% 53.7% 51.9%

ITCITC, like a falcon, is poised to soar to new heights. Price can be seen in 515, 520, 530, 550 Soon.
Just Observe the breakout
Happy Investing :)

Buy ITC aggressively CMP 492, Target-580 within a month.Technically we see a formation and breakout of Bullish Pennant chart pattern. Also we can confirm its strength from being continuously above all the short term averages even in market downside. ITC is a star performer and our last buy call at the bottom price of 425 worked very well. At higher levels also, surprisingly again it is in buy radar after formation and breakout of a beautiful chart pattern.
Last month Quant Mutual Fund bought ITC shares worth 3,669 crores. This is a big plus news as Quant MF are trending in MF industry due to their good buying decision and consistently outperforming the market benchmark returns. All the big institutions and Brokerage house already gave the target of 550 plus and technically it is confirming the same.
We feel that still there is a lot of value unlocking left in this counter due to their multiple businesses working so well as compared to the peers in the respective industry and still it is just valued majorly on based of Tobacco business. Demerger going ahead is the key to value unlocking and this share can quote even value of 750-800 soon and this is not hypothetical figure but based on real possible valuation in near term as well. So, buy this stock aggressively and you might think that the stock in last month already gone up and you might wait for the dips which might cost you a good opportunity as the big hand may not give you the dips unless there is a big fall in nifty itself. With regards to Nifty, it can give strong positive contribution to nifty movement and support nifty if other nifty stocks correct.

ITC Ltd intraday level for 9th Aug #ITC ITC Ltd intraday level for 9th Aug #ITC
Buying may witness above 490
Support area 490-492. Below ignoring buying momentum for intraday
Charts for Educational purposes only.
Please follow strict stop loss and risk reward if you follow the level.
Thanks,
V Trade Point

ITC in Multi-month BreakoutITC NSE:ITC is moving towards Breakout and you can buy above 455.
Target would be 485

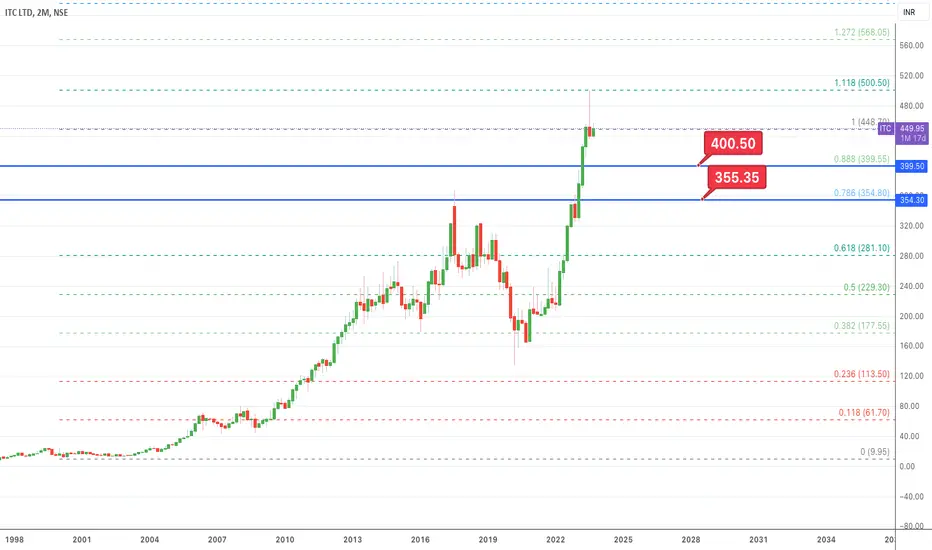
ITC: Long term viewLooks like ITC has done well so if one has to enter in this stock 400 or 355 will be a good place, so I think it has to correct more lets see what happens
Target 1: 400
Target 2: 355
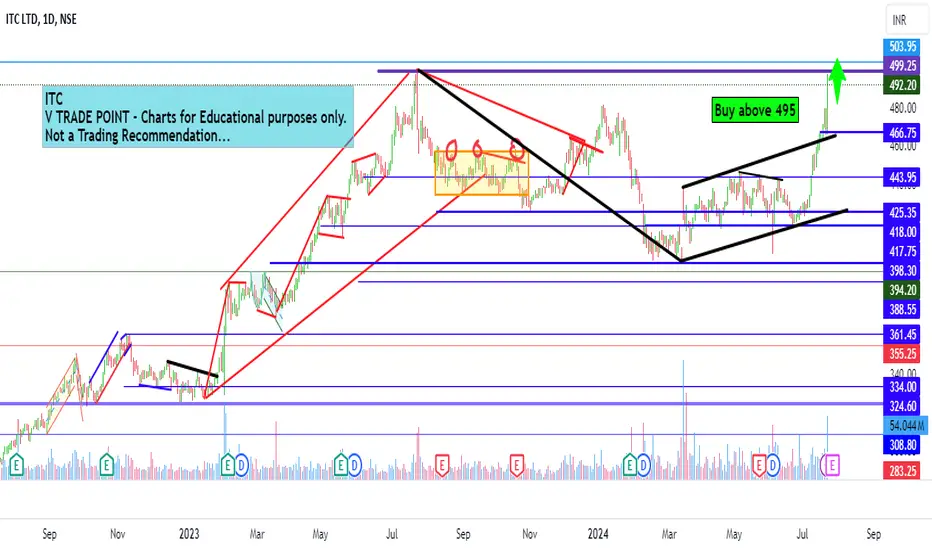
ITC Ltd Intraday level for 24th July #ITC ITC Ltd Intraday level for 24th July #ITC
Buying may witness above 495
Support area 490. Below ignoring buying momentum for intraday only
Charts for Educational purposes only.
Please follow strict stop loss and risk reward if you follow the level.
Thanks,
V Trade Point
ITC Long term Trading IdeaStock trade in symmetrical triangle pattern that is indecisive pattern we can expect both the direction after it can be bullish it can be bearish as per trade volume and delivery percentage but today, we can see a good volume on day chart with RSI 60 breakout and above 20sma volume. after a two-time rejection of falling trend line stock making higher high and higher lows with a very good volume. after some consolidation stock can go up to the level of 474 that is my first target. and as per day chart it can touch 455 in just a few days. keep that in mind this is a secular stock. Secular stock is nothing but a good and long-term bet stock that is not align with the economy growth.

ITC...Pattern Breakout....BuyFlag breakout...Tgt calculated and posted on chart...Time tgt calculated approximately..as per pattern...So buy..this is a good stock and you get good dividents too...

ITC Limited Intraday level for 18th July #ITC ITC Limited Intraday level for 18th July #ITC
Buying may witness above 467
Support area 462-460. Below ignoring selling momentum
Charts for Educational purposes only.
Please follow strict stop loss and risk reward if you follow the level.
Thanks,
V Trade Point

ITC-SELLITC- HOURLY-- Hit our 1st 5th wave trg of 464-65.40 and now heading toward fibo support 1 and 2 ( 442-446 ) LONGS TRG 494, 540 as given earlier.

ITCITC (monopoly in cigareete business) given confirmation of W pattern in weekly pattern. it can be a gud buy on this price range. sl will be 420
\
FIRST TARGET - 500
Risk reward ratio and probability is only the holy grail in the market.
Dont lose more than your entry reason.

ITC--SELL buy on dipITC- 15 min chart-- heading toward 5th wave 464-65.40 and correction to fibo to support 1 and 2 ( 442-446 ) LONGS TRG 494, 540 as given earlier.
