Clear breakout Clear trendline breakout and good to go long. Check volume and do your own analysis too. This is only for educational purposes.
JMFINANCIL trade ideas

JM FINANCIL Long consolidation BOLooks like a big cup & handle but not accurate.
The stock gave a long consolidation breakout, and volumes are also shooting up.

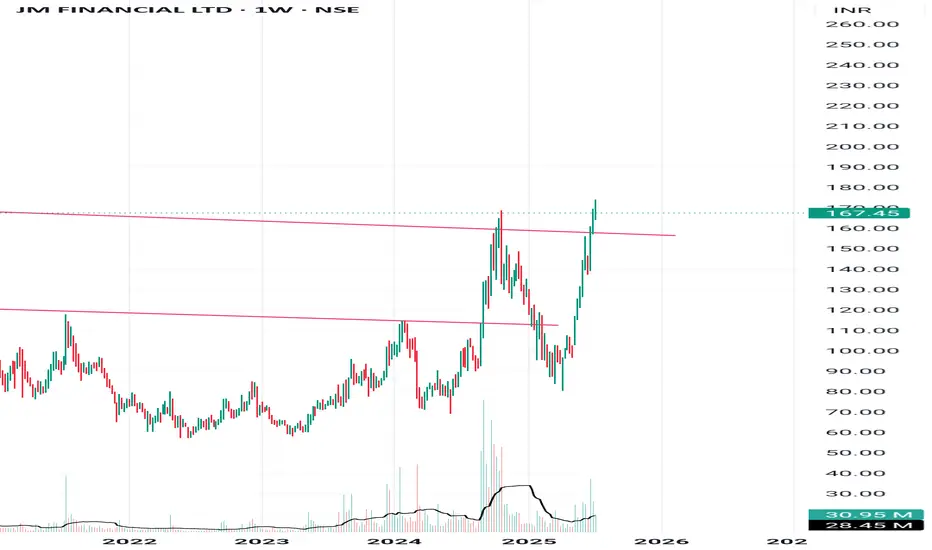
JM Financial: 6-Year Breakout with Huge Weekly Volume!🚀 JM Financial: 6-Year Breakout with Huge Weekly Volume! 🚀
Current Market Price: 119
Stop Loss: 85
Target: 170
JM Financial has achieved a major breakout after 6 years, with substantial weekly volume. The stock recently completed a box breakout above 112 and is now standing above the key neckline at 118, which it broke in September 2018 due to a head and shoulder pattern breakdown.
📈 Strategy: Consider pyramiding as the stock crosses 129 for potential gains.
📉 Risk Management: Use a stop loss at 85 to manage risk effectively.
📊 Disclaimer: As a non-SEBI registered analyst, I recommend conducting thorough research or seeking advice from financial professionals before making investment decisions. Exciting times ahead!
#MarketAnalysis #JMFinancial #TechnicalAnalysis #Breakout #InvestmentOpportunities #StockMarket

SWING IDEA - JMFINANCIALJM Financial , a diversified financial services group offering services in investment banking, brokerage, and asset management, is currently presenting a potential swing trade setup.
Reasons are listed below :
120 Zone Resistance Break : The 120 level has acted as a strong resistance since 2018. The price is now attempting to break through this zone, indicating possible continued upward movement.
Bullish Marubozu Candle on Weekly Timeframe : The formation of a bullish Marubozu candle on the weekly chart suggests strong buying pressure and a potential shift towards higher levels.
Massive Volume Increase : The surge in trading volumes supports the price movement, indicating strong market participation.
Constant Higher Lows : The formation of higher lows signals a consistent upward trend, reflecting increasing bullish sentiment.
Trading Above 50 and 200 EMA : The stock is trading above both the 50 and 200 exponential moving averages, which supports the overall bullish trend and indicates long-term strength.
Target - 150 // 170 // 190
Stoploss - weekly close below 105
DISCLAIMER -
Decisions to buy, sell, hold or trade in securities, commodities and other investments involve risk and are best made based on the advice of qualified financial professionals. Any trading in securities or other investments involves a risk of substantial losses. The practice of "Day Trading" involves particularly high risks and can cause you to lose substantial sums of money. Before undertaking any trading program, you should consult a qualified financial professional. Please consider carefully whether such trading is suitable for you in light of your financial condition and ability to bear financial risks. Under no circumstances shall we be liable for any loss or damage you or anyone else incurs as a result of any trading or investment activity that you or anyone else engages in based on any information or material you receive through TradingView or our services.
@visionary.growth.insights

JM Financial Near Key Breakout Level➡️ Bullish breakout above ₹129.63
➡️ Next resistance levels: ₹150.00 and ₹171.50

JM FINANCIAL LTD LONG6 year range breakout with ATH in volume. should buy here or wait for range high retest.. if fomo one should start building position here. looks really strong as does the whole finance sector on the whole.

JMFINANCIALHi guys,
In this chart i Found a Demand Zone in JMFINANCIAL CHART for Positional entry,
Observed these Levels based on price action and Demand & Supply.
*Don't Take any trades based on this Picture.
... because this chart is for educational purpose only not for Buy or Sell Recommendation..
Thank you

Trendline Breakout in JM FinancialJM Financial has given Breakout with Volume, this could be a possible swing trade. My Target could be 160 in 6-8 weeks.

Bullish in JM FinanceSee in Chart,
2 times W pattern in last few months.
As per my view,
If JM Finance close above 115 on weekly base.
Try to touch upside around 140-185
Not a Recommendation,
I only share my view.
Consult your financial adviser

Took position in JMJM Financial looks good here.
Added it positionally at 106.
SL is 100.
Target 2 x of SL
Do you own analysis before entering.

Weekly breakout in JM FinancialWeekly breakout in JM Financial.
A channel pattern breakout and limited stoploss.

JM Financial Weekly breakout possibleJM financial looking good for short term
concentrate if price sustain above 105
Weekly breakout possible..
Note*- The views expressed are based on personal observations/opinions. Please do you own research before making any trading decisions.


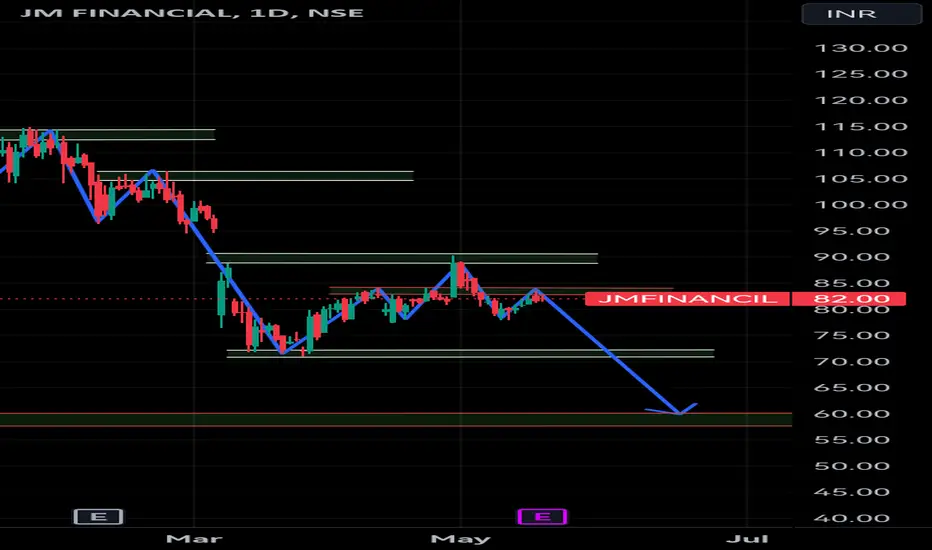
JM Financial - Long (17-12-2023)JM Financial
Buy @ CMP
For Target : 117-126-140-155
SL 60
Swing Trade
Holding Duration - Few days
Please consult your financial advisor before investing
All research for educational purposes only.

JM FIN. time to rerate.... Volume & price action say something.JM financial Q2 2024 result was declared yesterday due to PPOP increase net profit YOY decrease but it would be not much important if you have long term view. After 25 months consolidate in volume it sparked but price not move significant. So, can consider If monthly close above 94 then 108-118-125-137-150 SL below 72 Monthly base... Review more when reach 150 odd level... Till that buy on dip counter.

JMFINANCIAL trading near trend line in weekly timeframeJMFINANCIAL trading near trend line in weekly timeframe, it is near to breakout keep in watchlist

#JMFINANCIL Underperformer for more than a decadeUnderperformer since more than a decade. Is it gearing up to shine now?

JM Financial Long Term View JM Financial is forming a Symmetrical Triangle and has also given Breakout.
Entry is at 85.50
Target is 192.30
Stop Loss is at 60.50
(Note:- This View is purely based on Technical Analysis and is for educational purposes only, please consult with your financial advisor before taking any trade).

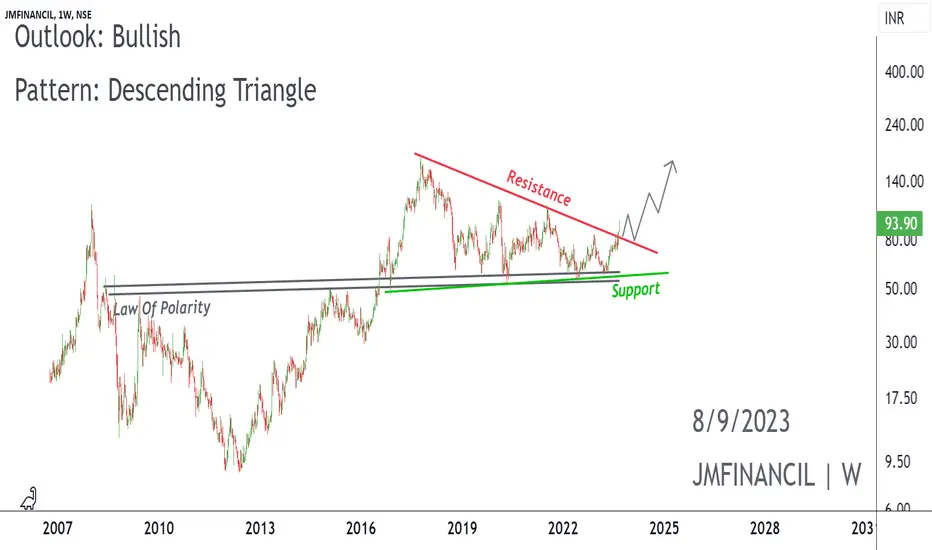
📈 Exciting Bullish Pattern Alert! 🐂📊 Pattern: Descending Triangle
📌 Symbol/Asset: JMF Financial
🔍 Description: Multi-year break out of pattern.
👉 Remember: Technical patterns are just one piece of the puzzle. Consider conducting further research, consulting with a financial advisor, and managing your risks appropriately.
Cup and Handle Pattern BreakoutPlease look into the chart for a detailed understanding.
Consider these for short-term & swing trades with 2% profit.
For BTST trades consider booking
target for 1% - 2%
For long-term trades look out for resistance drawn above closing.
Please consider these ideas for educational purpose

Jm Financial Services stock On bullishJm Financial Services stock On bullish… Chart Structure..
Double Bottom Pattern…. Target 116…. Very bullish…
