Jsw energy fibonachi supports Jsw has taken support of 418 (golden ration 61.8) and then at 490(ratio .5) so 485 is the stop loss and it is ready for target of 595
Cmo 512
JSWENERGY trade ideas

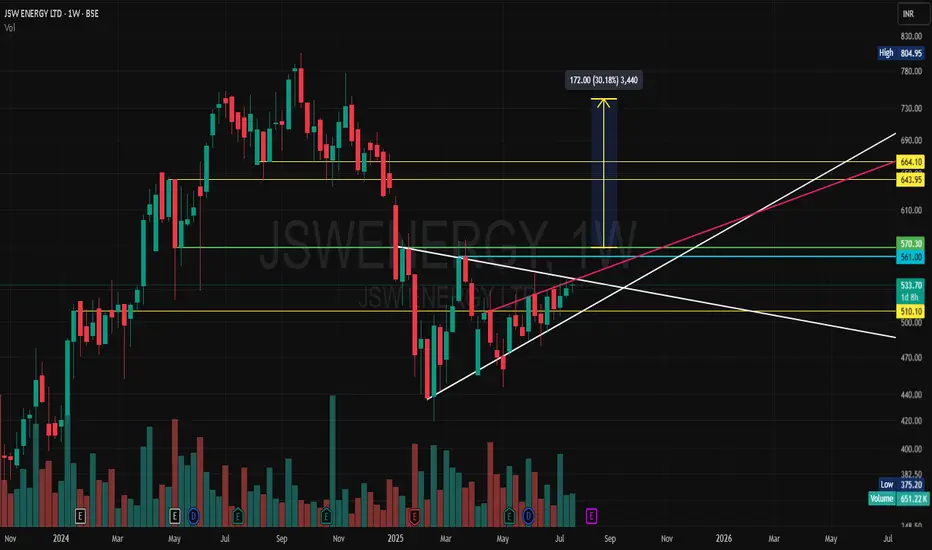
jsw energysymmertrical triangle (In white line)
Red Line inverse H&S Neckline
Blue Line Double bottom neckline.
Green line is also neckline can be resistance tgt above yellow lines and above
JSW ENERGY LONG TERM SWINGJSW Energy (JSWENERGY) - Trading Idea
Action: Buy
Buy Above: ₹527
Stop Loss (SL): ₹490
Target (TR): ₹580 / ₹640 / ₹700 / ₹754


JSW Energy trying to gain some energy and momentum.JSW Energy Ltd. engages in the business of power generation. It operates through the following business segments: Power Generation, Power Transmission, and Power Trading. The company was founded by Om Prakash Jindal on March 10, 1994 and is headquartered in Mumbai, India.
JSW Energy Ltd. Closing price is 497.4. The positive aspects of the company are Annual Net Profits improving for last 2 years, Consistent Highest Return Stocks over Five Years and MFs increased their shareholding last quarter. The Negative aspects of the company are high Valuation (P.E. = 45.2), Stocks Underperforming their Industry Price Change in the Quarter, Increasing Trend in Non-Core Income, Companies with Increasing Debt, Promoter decreasing their shareholding and Companies with high market cap, lower public shareholding.
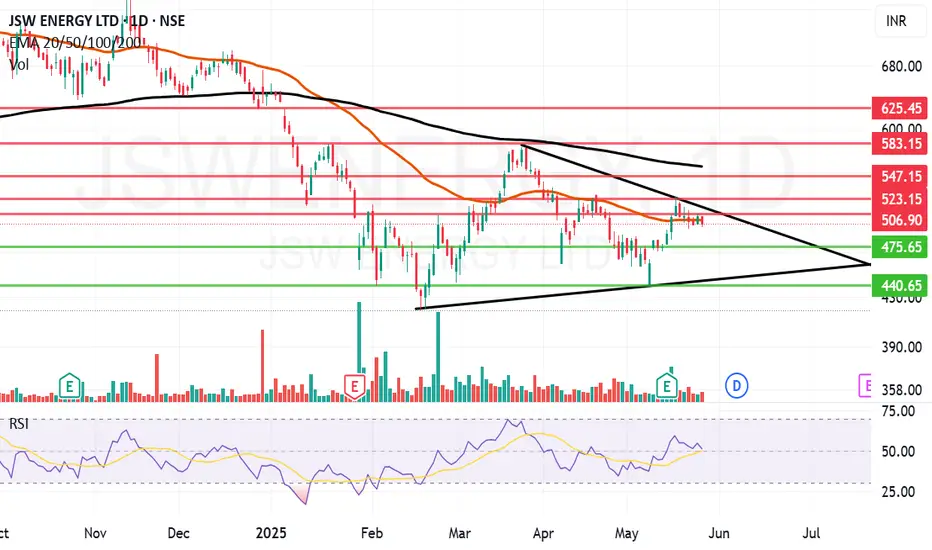
Entry can be taken after closing above 507 Historical Resistance in the stock will be 528, 547 and 567. PEAK Historic Resistance in the stock will be 583 and 625. Stop loss in the stock should be maintained at Closing below 475 or 440 depending upon your risk taking ability.
Disclaimer: The above information is provided for educational purpose, analysis and paper trading only. Please don't treat this as a buy or sell recommendation for the stock or index. The Techno-Funda analysis is based on data that is more than 3 months old. Supports and Resistances are determined by historic past peaks and Valley in the chart. Many other indicators and patterns like EMA, RSI, MACD, Volumes, Fibonacci, parallel channel etc. use historic data which is 3 months or older cyclical points. There is no guarantee they will work in future as markets are highly volatile and swings in prices are also due to macro and micro factors based on actions taken by the company as well as region and global events. Equity investment is subject to risks. I or my clients or family members might have positions in the stocks that we mention in our educational posts. We will not be responsible for any Profit or loss that may occur due to any financial decision taken based on any data provided in this message. Do consult your investment advisor before taking any financial decisions. Stop losses should be an important part of any investment in equity.
JSWENERGY Investment OpportunityWe can invest from current for short term.
Target 1: 530 and Target 2: 600
Tenure: 6 months
I am not SEBI registered so trade at your own risk.

JSW Energy bulish pattern JSW Energy bulish pattern cmp 484 on 09.2.25 it can agin retest and reverse for up side .


JSW Energy Ltd Analysis: Head and Shoulders Formation and Potent
Description :
The Head and Shoulders pattern on JSW Energy's daily chart suggests a potential reversal to the downside. The key support level at 601.55 is being tested, and if it breaks, we could see a further decline towards 520.60 . The pattern's key components are marked:
Left Shoulder : Formation before the rise.
Head : The peak followed by a consolidation.
Right Shoulder : Another attempt to rise but failing, indicating the reversal.
A clean breakdown below the neckline at 601.55 would signal a stronger bearish move.
Target Level : 520.60
Stay ahead of market movements with technical insights . Learn technical setups with @PriceActionTrader_yt.

JSW ENERGY BREAKOUT LEVELS JSW Energy - Potential Breakout Setup
📈 Analysis: JSW Energy is showing signs of building momentum. The stock is currently testing a key resistance zone at ₹ . If the price breaks above this level, we could see a strong breakout rally. A clean breakout above ₹ would confirm the bullish trend, potentially targeting ₹ in the near term.
🔑 Key Factors to Monitor:
Look for an increase in volume as confirmation of the breakout.
A close above ₹ on high volume will likely push the stock higher.
The RSI is showing strong bullish momentum, suggesting more upside potential.
Watch out for any reversal patterns or resistance re-tests after the breakout.
💡 Trade Idea:
📅 Timeframe: Watch for price action over the next few sessions to confirm the breakout.
📌 Disclaimer: This post is for educational purposes and does not constitute financial advice. Always perform your own analysis or consult a professional before making any trades.

JSWENERGY : at ease support zoneJSW Energy Ltd. (JSWENERGY)
Key Levels and Zones :
Current Price: ₹625.80 (-₹10.70, -1.68%)
Support and Buying Zones:
Extended Retracement Zone: ₹596.60 - ₹619.60
Wave C (Primary) Completion Zone: ₹594 - ₹610
Liquidity Sweep Zone: ₹553 - ₹565
Targets:
First Swing Target: ₹747.00
Second Target Zone: ₹825 - ₹851
Stop Loss: ₹540.00 (on failure of Wave C and extended retracement zone)
Chart Analysis :
Wave Patterns: The daily chart shows Elliott Wave patterns (Waves A, B, and C).
Wave C Completion Zone: ₹594 to ₹610 suggests a potential bullish reversal.
Change of Character (ChOCH): A shift in market sentiment is observed, indicating a likely trend change.
Future Price Projections :
Bullish Scenario:
If Wave C completes successfully, the price may rally towards the first swing target at ₹747.00 and the second target zone between ₹825 and ₹851.
Bearish Scenario:
Failure to hold the Wave C support zone could result in a drop to the stop-loss level around ₹540.00.
Conclusion :
The daily chart of JSW Energy highlights critical support and resistance levels. Traders can monitor these zones for strategic entry and exit opportunities, ensuring a favorable risk-reward ratio.
Disclaimer: This analysis is for educational purposes only and does not constitute financial advice. Always conduct your analysis or consult a financial advisor before making investment decisions.
#JSWEnergy #TradingPlan #ElliottWave #TechnicalAnalysis #StockMarket

JSW Energy looking Energetic JSW Energy Ltd. engages in the business of power generation. It operates through the following business segments: Power Generation, Power Transmission, and Power Trading.
JSW Energy Ltd. CMP is 688.95. The Positive aspects of the company are Company with decreasing Promoter pledge, High Volume, High Gain, Top Gainers and High Momentum Scores. The Negative aspects of the company are extremely high Valuation (P.E. = 61.5), Companies with Increasing Debt, Increasing Trend in Non-Core Income, High promoter stock pledges.
Entry can be taken after closing above 701 Targets in the stock will be 719, 738 and 756. The long-term target in the stock will be 773, 792 and 809. Stop loss in the stock should be maintained at Closing below 642 or 582 depending on your risk taking ability.
Disclaimer: The above information is provided for educational purpose, analysis and paper trading only. Please don't treat this as a buy or sell recommendation for the stock. We do not guarantee any success in highly volatile market or otherwise. Stock market investment is subject to market risks which include global and regional risks. We will not be responsible for any Profit or loss that may occur due to any financial decision taken based on any data provided in this message.

JSW ENERGY- Xtweets Comment1) Might go into consolidation or lows
2) Though chart seems good
but I am afraid to enter at this level

JSWENER S/RSupport and Resistance Levels:
Support Levels: These are price points (green line/shade) where a downward trend may be halted due to a concentration of buying interest. Imagine them as a safety net where buyers step in, preventing further decline.
Resistance Levels: Conversely, resistance levels (red line/shade) are where upward trends might stall due to increased selling interest. They act like a ceiling where sellers come in to push prices down.
Breakouts:
Bullish Breakout: When the price moves above resistance, it often indicates strong buying interest and the potential for a continued uptrend. Traders may view this as a signal to buy or hold.
Bearish Breakout: When the price falls below support, it can signal strong selling interest and the potential for a continued downtrend. Traders might see this as a cue to sell or avoid buying.
20 EMA (Exponential Moving Average):
Above 20 EMA(50 EMA): If the stock price is above the 20 EMA, it suggests a potential uptrend or bullish momentum.
Below 20 EMA: If the stock price is below the 20 EMA, it indicates a potential downtrend or bearish momentum.
Trendline: A trendline is a straight line drawn on a chart to represent the general direction of a data point set.
Uptrend Line: Drawn by connecting the lows in an upward trend. Indicates that the price is moving higher over time. Acts as a support level, where prices tend to bounce upward.
Downtrend Line: Drawn by connecting the highs in a downward trend. Indicates that the price is moving lower over time. It acts as a resistance level, where prices tend to drop.
RSI: RSI readings greater than the 70 level are overbought territory, and RSI readings lower than the 30 level are considered oversold territory.
Combining RSI with Support and Resistance:
Support Level: This is a price level where a stock tends to find buying interest, preventing it from falling further. If RSI is showing an oversold condition (below 30) and the price is near or at a strong support level, it could be a good buy signal.
Resistance Level: This is a price level where a stock tends to find selling interest, preventing it from rising further. If RSI is showing an overbought condition (above 70) and the price is near or at a strong resistance level, it could be a signal to sell or short the asset.
Disclaimer:
I am not a SEBI registered. The information provided here is for learning purposes only and should not be interpreted as financial advice. Consider the broader market context and consult with a qualified financial advisor before making investment decisions.

Jsw Energy ltd waiting for breakout (MS)Waiting for breakout
if they break the trendline and point c of the upper side then it goes to rocket
target ==>> 900
entry ==>> breakout of the trendline
SL == 680
This chart is only for educational purpose wait and watch

JSW Energy can move after breakout level of 750 -753JSW Energy
It's been clearly consolidating and respecting support and resistance.
It can move after breakout levels of 750-753
Can be a good swing trade with good RR ratio
And buzz about energy stocks can also help in momentum

JSW Energy Ltd view for Intraday 9th September #JSWENERGY JSW Energy Ltd view for Intraday 9th September #JSWENERGY
Buying may witness above 715
Support area 702. Below ignoring buying momentum for intraday
Selling may witness below 702
Resistance area 715
Above ignoring selling momentum for intraday
Charts for Educational purposes only.
Please follow strict stop loss and risk reward if you follow the level.
Thanks,
V Trade Point

JSW ENERGY LTDJSW ENERGY LTD
Good company
.
.
Above 630-645 Big move possible
BB also blast above 645
.
SL Yesterday low closing basis.

JSWENERGY long setupThis is a text book example of pattern
Consolidation drop and gain
If it follows this trend the targets can be acheived

JSWENERGY - BULLISHStock name = JSW Energy Limited.
Weekly chart setup
Chart is self explanatory. Levels of breakout, possible up-moves (where stock may find resistances) and support (close below which, setup will be invalidated) are clearly defined.
Master Score - B
Disclaimer: This is for demonstration and educational purpose only. this is not buying and selling recommendations. I am not SEBI registered. please consult your financial advisor before taking any trade.

3 black crows in jsw energy ltdJsw energy ltd last 15 minute candle shows 3 black crows with high volume so we can take short position.

JSW Energy (JSW) : A sunrise power sector7/11 - Jefferies next 5 year companies
Jefferies target by March 2029 - 1,100
India is experiencing a power sector boom with major demand coming in upcoming years and JSW Energy with it's strong JSW parentage could be one of the leading companies to power India!
Company is in a consistent uptrend! SL - 450.
