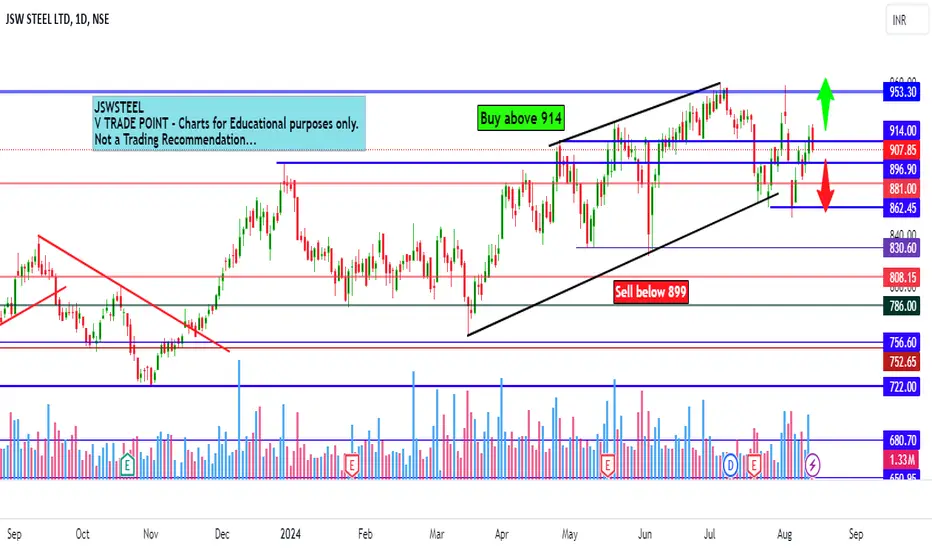
JSW Steel Ltd intraday level for 14th Aug #JSWSTEEL JSW Steel Ltd intraday level for 14th Aug #JSWSTEEL
Buying may witness above 914
Support area 905. Below ignoring buying momentum for intraday
Selling may witness below 899
Resistance area 905-910. Above ignoring selling momentum for intraday
Charts for Educational purposes only.
Please follow strict stop loss and risk reward if you follow the level.
Thanks,
V Trade Point
JSWSTEEL trade ideas
JSW Steel Ltd intraday level for 6th Aug #JSWSTEEL JSW Steel Ltd intraday level for 6th Aug #JSWSTEEL
Buying may witness above 870
Support area 860. Below ignoring buying momentum for intraday
Selling may witness below 854
Resistance area 860. Above ignoring selling momentum for intraday
Charts for Educational purposes only.
Please follow strict stop loss and risk reward if you follow the level.
Thanks,
V Trade Point

Jsw Steel Ltd Intraday level for 31st July #JSWSTEEL Jsw Steel Ltd Intraday level for 31st July #JSWSTEEL
Buying may witness above 906
Support area 895. Below ignoring buying momentum for intraday
Selling may witness below 896
Resistance area 905-908 Above ignoring selling momentum for intraday
Charts for Educational purposes only.
Please follow strict stop loss and risk reward if you follow the level.
Thanks,
V Trade Point

JSW Steel ltd Intraday level for 26th July #JSWSTEEL JSW Steel ltd Intraday level for 26th July #JSWSTEEL
Buying may witness above 881
Support area 875. Below ignoring buying momentum for intraday
Selling may witness below 875
Resistance area 881-885. Above ignoring selling momentum for intraday
Charts for Educational purposes only.
Please follow strict stop loss and risk reward if you follow the level.
Thanks,
V Trade Point

Jsw Steel Intraday level for 25th July #JSWSTEEL Jsw Steel Intraday level for 25th July #JSWSTEEL
Selling may witness below 875
Resistance area 885-888. Above ignoring selling momentum for intraday
Charts for Educational purposes only.
Please follow strict stop loss and risk reward if you follow the level.
Thanks,
V Trade Point


Jswsteel Intraday level for 28th June #JSWSTEEL Jswsteel Intraday level for 28th June #JSWSTEEL
Buying opportunity above 947
Stop Loss area 939
Charts for Educational purposes only.
Please follow strict stop loss and risk reward if you follow the level.
Thanks,
V Trade Point

JSWSTEEL LTD Intraday level fo 27th June #JSWSTEEL JSWSTEEL LTD Intraday level for 27th June #JSWSTEEL
Selling opportunity below 914
Stop Loss area 925
Charts for Educational purposes only.
Please follow strict stop loss and risk reward if you follow the level.
Thanks,
V Trade Point

JSW STEEL Short term view.JSW STEEL is sustaing above is important resistance
indicating bullishness for short-term. Possible targets are 950,965,975,980.

JSW STEEL S/R Support and Resistance Levels: In technical analysis, support and resistance levels are significant price levels where buying or selling interest tends to be strong. They are identified based on previous price levels where the price has shown a tendency to reverse or find support.
Support levels are represented by the green line and green shade, indicating areas where buying interest may emerge to prevent further price decline.
Resistance levels are represented by the red line and red shade, indicating areas where selling pressure may arise to prevent further price increases. Traders often consider these levels as potential buying or selling opportunities.
Breakouts: Breakouts occur when the price convincingly moves above a resistance level (red shade) or below a support level (green shade). A bullish breakout above resistance suggests the potential for further price increases, while a bearish breakout below support suggests the potential for further price declines. Traders pay attention to these breakout signals as they may indicate the start of a new trend or significant price movement.
Disclosure: I am not SEBI registered. The information provided here is for learning purposes only and should not be interpreted as financial advice. It is important to consult with a qualified financial advisor before making any investment decisions. Tweets neither advice nor endorsement.
Intraday view JSWSTEEL for tomorrow 21st MayIntraday view JSWSTEEL for tomorrow 21st May
Expecting buying opportunity above 903
Follow strict risk reward and stop loss
Charts for Educational purposes only.
Thanks,
V Trade Poin

Clear Breakout Stock Jsw Steel cmp 900
upside :- 950, 1000
support :- 838
waiting for Sustain above B.O Level

JSW STEEL S/R Support and Resistance Levels: In technical analysis, support and resistance levels are significant price levels where buying or selling interest tends to be strong. They are identified based on previous price levels where the price has shown a tendency to reverse or find support.
Support levels are represented by the green line and green shade, indicating areas where buying interest may emerge to prevent further price decline.
Resistance levels are represented by the red line and red shade, indicating areas where selling pressure may arise to prevent further price increases. Traders often consider these levels as potential buying or selling opportunities.
Breakouts: Breakouts occur when the price convincingly moves above a resistance level (red shade) or below a support level (green shade). A bullish breakout above resistance suggests the potential for further price increases, while a bearish breakout below support suggests the potential for further price declines. Traders pay attention to these breakout signals as they may indicate the start of a new trend or significant price movement.
Disclosure: I am not SEBI registered. The information provided here is for learning purposes only and should not be interpreted as financial advice. It is important to consult with a qualified financial advisor before making any investment decisions. Tweets neither advice nor endorsement.


Just A View - JSWSTEEL 📊 Script: JSWSTEEL
📊 Sector: Steel
📊 Industry: Steel - Large
Key highlights: 💡⚡
📈 Script is trading near middle band of BB.
📈 MACD is giving crossover .
📈 Double Moving Averages will give crossover soon.
📈 Right now RSI is around 54.
📈 Stock is trading into narrow range which means consolidation which is highlighted into chart.
📈 Stock is trading between 794 to 845 rang.
📈 One can go for Swing Trade only above 845 level.
⏱️ C.M.P 📑💰- 845
BUY ONLY ABOVE 845
⚠️ Important: Always maintain your Risk & Reward Ratio.
✅Like and follow to never miss a new idea!✅
Disclaimer: I am not SEBI Registered Advisor. My posts are purely for training and educational purposes.
Eat🍜 Sleep😴 TradingView📈 Repeat 🔁


Triple BottomSector in Bull
Stock has huge consolidation
it is time to get over the consolidation
Just wait for closing above resistance.
Follow the Stoploss and it is wise to follow such pattern in favor of trend
For confirmation that stock is holding 200 MA firmly
MACD is positive Side..

🤦🧪📉 Example JSW Steel - Selling on Strength Helps NSE:JSWSTEEL
An Introduction to Price Action Trading Strategies helps for long-term investing as well. Here in this example of JSW steel,where would be better off selling in price action strength when stock price jump usually at a higher level
The first thing I do is look at the chart and see if it has any apparent patterns. If not, then I will look at the volume profile.
This tells me whether the stock is driven by fundamental news or technical factors.
Exiting would have saved you 17 months of underperformance and also testing your patience.
Learn the Opportunity cost your money
disc: Never invested , no intention at the moment. Sharing knowledge that

JSWSTEEL--Drop Base Dropprice is trading in bullish channel form long time.
taking the support multiple times from trendline
This stock is now in consolidation
we detected a drop from the upper resistance channel,
after a long time consolidation price is moving upside to test this resistance,
if price comes to bottom side,trendline is ready to push the price up,if failed to push the price up,
then will look for short side from the topside of consolidation area.
keep an eye on this stock for short side.

Jsw Steel Rising Wedge Pattern failed and ready for sellSell Only if comes below 800.Sl 827 and Target 767. Explained in the diagram. Trade your Own Risk.Do your own research before enter a trade. Good Luck all

JSW STEEL Upside levelAs per my analysis, NSE:JSWSTEEL has been tested 820.55 two times which is breakout levels for 843.00. If price crossed 821, there would be high probability for target of 843.00.
Note: This is my personal analysis, only to learn stock market behavior. Kindly do your own analysis before take any trade. Thanks.

JSW STEEL S/R for 9/2/24Support and Resistance Levels:
Based on the price action, you have to identify two significant levels: the red line acting as resistance and the green line acting as support. Additionally, there have marked red and green shades to represent resistance and support zones, respectively.
Support: The green line and green shade represent support levels. These levels are where the price tends to find buying interest, preventing it from falling further. Traders can consider these levels as potential buying opportunities.
Resistance: The red line and red shade represent resistance levels. These levels are where the price tends to encounter selling pressure, preventing it from rising further. Traders can consider these levels as potential selling opportunities.
Breakouts: If the price breaks above the resistance zone (red shade) convincingly, it may indicate a bullish breakout, and the price could move higher to the next resistance level. On the other hand, if the price breaks below the support zone (green shade) convincingly, it may indicate a bearish breakout, and the price could move lower to the next support level.
Keltner Channel:
The Keltner Channel is a technical indicator that uses an exponential moving average (EMA) to create an upper and lower channel around the price action. Traders can use this channel to identify potential long and short positions.
Long Position: If the price is above the upper line of the Keltner Channel, it may indicate a potential long opportunity, as it suggests the price is trading above the average range and might continue in an upward trend.
Short Position: If the price is below the lower line of the Keltner Channel, it may indicate a potential short opportunity, as it suggests the price is trading below the average range and might continue in a downward trend.
Disclosure: I am not SEBI registered. I just wanted to let you know that the information provided here is for learning purposes only. Please consult your financial advisor before making any decisions. Tweets neither advice nor endorsement.

Double bottom in JSW Steel going to break Double bottom pattern found in JSW Steel. expecting to break soon. Buy above 823. target 853. sl 794. once if you are in profit zone please put your sl in profit zone. Trade your own risk.
good luck all.
