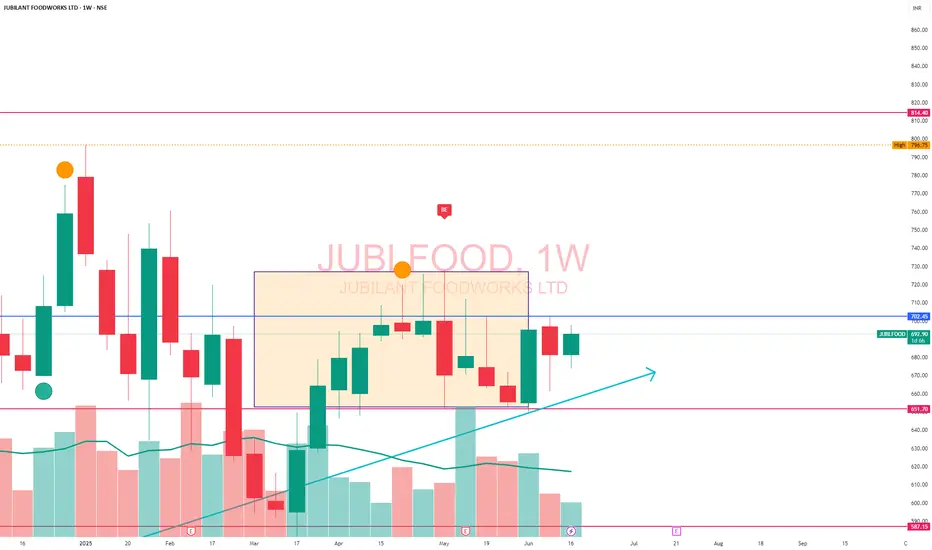
JUBLFOODJubilant Food is looking good on Weekly chart frame, Trade can be taken above 700, 10,20,20, points can be earned in shorts span.
JUBLFOOD trade ideas
$NSE:JUBLFOOD emitting Multibagger sign to me ! Going to Double
Jubilant FoodWorks continues to lead the QSR sector in India with a dominant Domino’s operation, rapid expansion, tech-savvy strategies, and growing digital/delivery revenue. While inflation and discounting squeeze margins, strategic initiatives in chicken, app-first ordering, and sustainability make it a resilient and forward-looking foodservice giant.
For investors, Jubilant stands strong on growth metrics, though a high valuation necessitates cautious optimism. For employees, it offers significant career momentum in a fast-paced setting, albeit with pressure and potential work-life trade-offs.
Aggressive store expansion: Adding ~50–130 new outlets per quarter, including strong growth in Domino's and initial Popeyes rollout
Digital-first approach: Focus on 20‑minute delivery, app-based orders, loyalty programs, in-house logistics—reducing reliance on third-party platforms
Product innovation: Launching mid-price chicken offerings (e.g., wings), premium pizzas (e.g., Cheese Volcano), responding to Gen‑Z demand
Tech & sustainability: Investments in energy-efficient stores, solar power, e‑bikes fleet, AI-driven supply chain, warehouse & delivery tech

JUBLFOOD : at completion of corrective wave C🔍 Trading Idea: Jubilant Foodworks Ltd. (NSE: JUBLFOOD)
📈 Timeframe: 1H
💰 Current Price: ₹621.55
🎯 Swing Target: ₹709 - ₹723
🎯 Options Target: ₹673
📉 Extended Retracement Zone: ₹602 - ₹630
📉 Extended Wave C Preparation Zone: ₹601 - ₹589
🛑 Stop Loss: ₹585 (Hourly Close)
📊 Analysis:
The stock has shown a sharp rebound from the extended retracement zone (A) near ₹602-₹630.
A potential breakout is forming at point (B), indicating a move towards the swing target of ₹709-₹723.
The extended Wave C preparation zone (C) at ₹601-₹589 acts as a critical support level.
Maintain a strict stop loss at ₹585 to manage risk.
🚀 Strategy:
Entry: Consider entering around current levels or on a pullback to ₹610-₹615.
Risk Management: Tight stop loss at ₹585 to protect against downside.
Exit: Take profits near ₹709-₹723 for swing traders or ₹673 for options traders.
Disclaimer: I am not a financial adviser; please consult one. Don't share information that can identify you.

Review and plan for 15th May 2025 Nifty future and banknifty future analysis and intraday plan.
Quarterly results.
This video is for information/education purpose only. you are 100% responsible for any actions you take by reading/viewing this post.
please consult your financial advisor before taking any action.
----Vinaykumar hiremath, CMT

Jubliant foodworks (695 ) breakout ..target 860Jubliant foodworks (695 ) has given breakout from round bottom pattern after completing pllback test. We expect it will move to 860 in coming days.
News :
Jubilant Foodworks Gets Order Demands GST Of 27.2 Million Rupees
ROE at 19%
Compounded 10 years Sales Growth at 13%
Dividend payout of 20.4%

JUBLFOOD | LONG REVERSALJUBLFOOD is currently at strong support and reversing from here.
The first hourly candle closed quite strongly and ever since then, the price has been forming HLs.
Long reversal position can be built up for a Target to 647 price level.

JUBLFOODJUBLFOOD
watch above levels. redline is our SL.
DISCLAIMER : I am NOT a SEBI registered advisor or a financial adviser. All the views are for educational purpose only.

JUB FOODS-LIKELY TRI ANGLE BRAK OUTJUB.FOODS:Shall keep in your watch list. Showing signs of reversal.Watch out for 715 Levels and if sustains above 715 ,likely to test 750 followed by 800 -Triangle pattern b/out likely(For educational purpose only)


JUBLFOOD | SHORT | STBTJUBLFOOD is showing good amount of weakness from the open. The first hour of price action is indicating complete negative bias and the overall trend also seems to be weak.
Short position can be initiated for a Target to 673 level.
SL will be todays High.

JUBLFOOD cup & handleAlthough I'm bearish on Indian markets and predicting 21000 as the target, these scrips are popping up on my radar.
It's suggested to enter based on your risk capability.
The entry will be only on a strong close of the daily candle above 745, and the stop-loss (SL) will be the low of the handle.

POV : JUBLFOOD : Cup and Handle PatternPOV : JUBLFOOD : Cup and Handle Pattern
Chart Reading:
1. Cup and Handle Pattern Breakout
2. Trend and MoM are in sync.
POA and Pattern Target mentioned on Chart
For educational purposes only. This is not financial advice. Please consult a professional before making financial decisions.
#NiVYAMi

JUBLFOOD Cup & Handle Pattern
RSI Above 60 Daily / Weekly / Monthly
718 Resistance breaks
Support 702
Expected Level 773 / 875 / 915

Juilfood cup and handle breakout #juilfood
The stock has corrected for a long time. And made a perfect cup and handle pattern on daily time frame. Now its near the breakout level, above 725 closing, it can be taken for long. Perfect set up for Swing trade.

Jubiliant Food Short @ 715.00 Rs HEllo frds ,
Jubiliant food Short from current price level 715.00 Rs
Stoploss 755.00 Rs
bottom Target 400- 450 Rs zone , its pure positional trade.
for more better ideal keep boost the idea if u like it and follow me .

Amazing breakout on Weekly Timeframe - JUBLFOODCheckout an amazing breakout happened in the stock in Weekly timeframe, macroscopically seen in Daily timeframe. Having a great favor that the stock might be bullish expecting a staggering returns of minimum 25% TGT. IMPORTANT BREAKOUT LEVELS ARE ALWAYS RESPECTED!
NOTE for learners: Place the breakout levels as per the chart shared and track it yourself to get amazed!!
#No complicated chart patterns
#No big big indicators
#No Excel sheet or number magics
TRADE IDEA: WAIT FOR THE STOCK TO BREAKOUT IN LOWER TIMEFRAME AND RETRACE IF NEEDED. SL IS NEARER SUPPORT ZONE IN Daily TIMEFRAME.
Checkout an amazing breakout happened in the stock in Weekly timeframe.
Breakouts happening in longer timeframe is way more powerful than the breakouts seen in Daily timeframe. You can blindly invest once the weekly candle closes above the breakout line and stay invested forever. Also these stocks breakouts are lifelong predictions, it means technically these breakouts happen giving more returns in the longer runs. Hence, even when the scrip makes a loss of 10% / 20% / 30% / 50%, the stock will regain and turn around. Once they again enter the same breakout level, they will flyyyyyyyyyyyy like a ROCKET if held in the portfolio in the longer run.
Time makes money, GREEDY & EGO will not make money.
Also, magically these breakouts tend to prove that the companies turn around and fundamentally becoming strong. Also the magic happens when more diversification is done in various sectors under various scripts with equal money invested in each N500 scripts.
The real deal is when to purchase and where to purchase the stock. That is where Breakout study comes into play.
LET'S PUMP IN SOME MONEY AND REVOLUTIONIZE THE NATION'S ECONOMY!

JUBLFOOD- Analysis
Bullish Levels -above 436 then 530 (CMP is above this) then 692 then 854 then 1016 then 1178
Bearish below 421
**Consider +/-15 Points buffer in above levels
**Disclaimer -
I am not a SEBI registered analyst or advisor. I does not represent or endorse the accuracy or reliability of any information, conversation, or content. Stock trading is inherently risky and the users agree to assume complete and full responsibility for the outcomes of all trading decisions that they make, including but not limited to loss of capital. None of these communications should be construed as an offer to buy or sell securities, nor advice to do so. The users understands and acknowledges that there is a very high risk involved in trading securities. By using this information, the user agrees that use of this information is entirely at their own risk.
Thank you.


Review and plan for 26th December 2024Nifty future and banknifty future analysis and intraday plan.
This video is for information/education purpose only. you are 100% responsible for any actions you take by reading/viewing this post.
please consult your financial advisor before taking any action.
----Vinaykumar hiremath, CMT

Jubilant Foodworks: Cup and Handle formationJubilant Foodworks is forming a cup and handle pattern, this indicates that the trend is going to continue upwards. But however this might be slow, please wait for the breakout. This is purely for education, no buy or sell call here.

#JUBILANT FOODWORKS LTD#JUBLFODD Make Rounding Bottom Chart Pattern
Buy - If daily price close above 715
Stop Loss - 630
Target - 875
Duration - 2 to 3 Month

Jubilant Foods - Bullish towards 1000The stock has shown bullish momentum , the stock is expected to hit the levels of 830 level initially and eventually to 1000.

JUBILANT FOODWORKS LTDJUBILANT FOODWORKS LTD
JUBILANT FOODWORKS LTD is part of the Jubilant Bhartia Group and is one of India’s largest food service Companies. The Company holds the master franchise rights for two international brands, Domino’s Pizza and Dunkin' Donuts addressing two different food market segments and now has Popeyes in its food segment.
.
FII Increased its holding from 20.38% to 21.01%.
DII Increased its holding from 29.69%to 30.19%.
OPM% has been consistent at 20% for the last 6 quarters.
.
CMP-645
BUY at cmp
SL is 600
Deep sl 580
.
TG-720, 2TG-820
.
This is Kartik Thakur,
Signing off
:)
