justdial going to take support justdial going to take support. support level 920-930 good buy opportunity at a dip target is huge 1200++
JUSTDIAL trade ideas

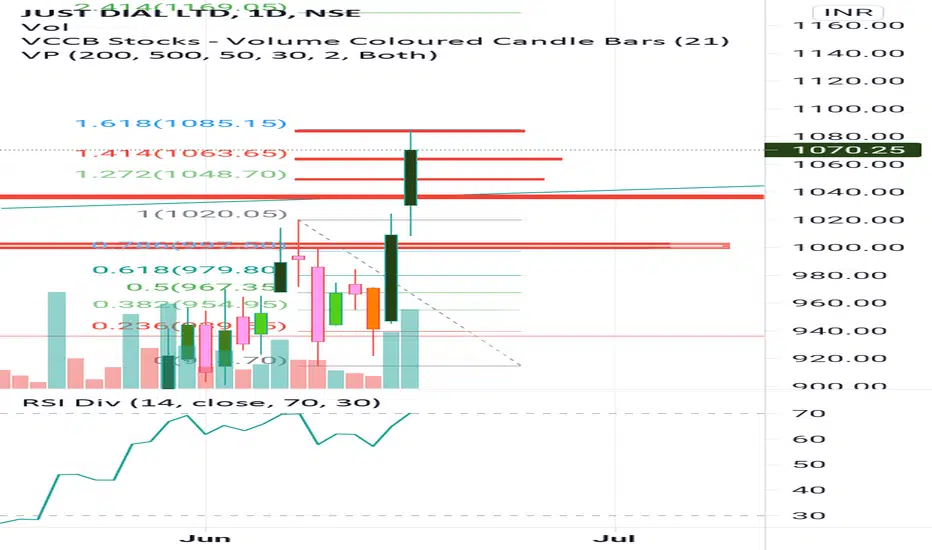
WATCH FOR ATH BREAKOUT IN JUSTDIALjustdial looks good above 1070 on closing basis for ATH breakout for positional target of 7-9%/ RSI is adove 60 with volume breakout


JustDial : Long OpportunityBullish above 1110
Target 1190, 1400
SL: 1000
Risk is yours and Reward is too yours totally
Above all resistance

Keep Eyes On JUSTDIAL. Little Story of False Breakouts. NSE:JUSTDIAL
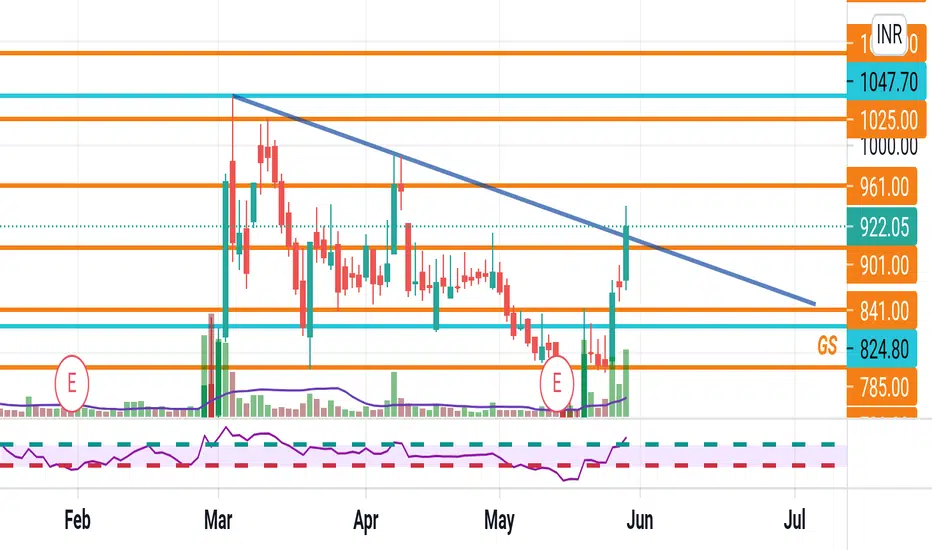
Just dial was been in a consolidation phase for a long enough time between the price range of 318-824. On 1st March 2021 weekly chart we did managed to see false breakout to the level of 824, result of which we see down move from there towards 717 and we have seen good reversal confirming support of 717 on 17th May 2021 weekly candle.
After week of 17th May 2021 we did see some good upside momentum in Just Dial till 1047. And once again a good rejection candle on a week 14th June 2021 at the level of 1047 which form a solid wick indicating one more false breakout. But now price did not fall as much as we seen after a false breakout of 1st March 2021, and this indicates less sellers or now participants are not interested to go short in Just Dial. Result of which we see strong bullish candle with good efforts in a last week (05th July 2021).
After kind of painful movement there will be hardly anyone who can keep blind faith in Just Dial or at least no one will expect steady trend in this counter. But as mention previously, its seems there is not enough supply in this counter for now.
Short to long term players can consider this counter for targets of 1286, 1426 and 1627 with SL below 700.
|| Hari Om ||
|| Ambdnya ||


JUST DAILJUST DIAL OVERALL LOOKING POSITIVE TREND TODAY HIT 1084.5 RESISTANCE HOPE FURTHER END OF TREND... just guidelines of trade not for trade
.
JUST DIAL 💲🤑sustaining above previous swing level with good volume.
delivery quantity is much more higher than previous 10days delivery.


Buy Stock trade near all time high and break it then go for long to swing positional trading
Long term investment (for target 1 1500 & target2. 2000

JUST DIALGood long expected. Breakout level retested. RSI showing strength. Levels provided for support and resistance.
JUSTDIAL - LONG BuildupJustDial looks interesting for its next move.
- Strong volumes
- Approaching trendline resistance
- RSI levels are looking bullish.
- Completed BO and retest
One can go long above 930 levels with SL 830 CLSB
Targets 1030/1200/1400++


BREKOUT FROM PREVIOUS RESISTANCELOOKS LIKE SELLING IS OVER IN STOCK AND NOW IT IS READY FOR A UPMOVE AS STOCK IS NOW TRADING ABOVE RESISTANCE LINE 818. THIS BREAKOUT HAS COME WITH GOOD VOLUMES TOO.


JUST DIAL LTDLong for 15 to 30 days for tp3
Tp1 - 1 week
Tp2 - aprox. 2 week
Tp3 - abow aprox. 2 week to 4 week

Just dial buying patternJust break 1 day time frame trend line and follow the basic rules of price action(after breakuout resistance become support) and they break their trend line from intial high!

Below 850 it can give good move downsideBelow 850 it can give good move downside, looking at Indian market sentiment it will break tomorrow itself. let's watch this level. just learning
In daily timeframe it has taken support at 850 multiple time.


JUST DIAL jUST DIAL FORMED A SYMMETRICAL TRIANGLE RED LINE IS A TARGET FOR INTRADAY OR BTST. TRADE ON UR OWN RISK REWARD.
