Kei Industries Ltd view for Intraday 26th May #KEI Kei Industries Ltd view for Intraday 26th May #KEI
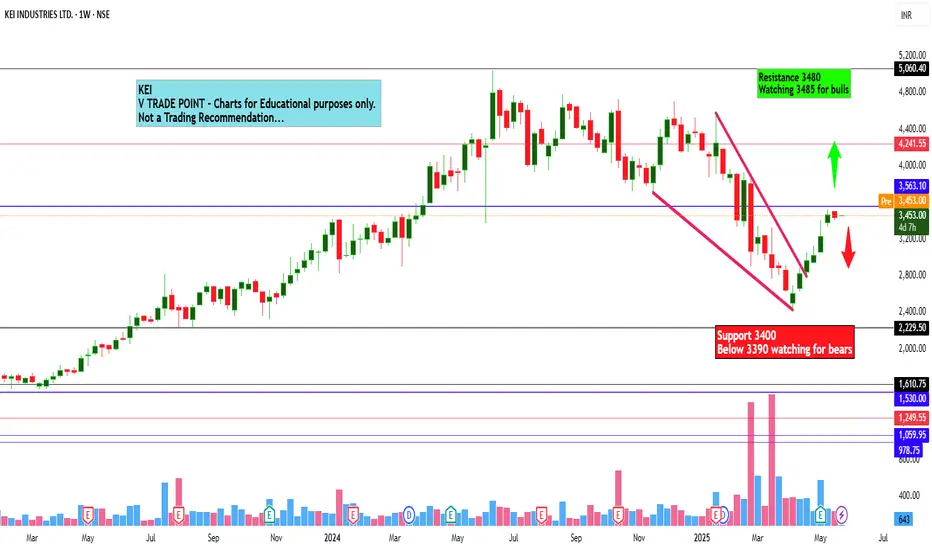
Resistance 3480 Watching above 3485 for upside momentum.
Support area 3400 Below 3440 ignoring upside momentum for intraday
Watching below 3390 for downside movement...
Above 3440 ignoring downside move for intraday
Charts for Educational purpos
Next report date
—
Report period
—
EPS estimate
—
Revenue estimate
—
75.40 INR
6.96 B INR
97.36 B INR
61.04 M
About KEI INDUSTRIES LTD.
Sector
Industry
CEO
Anil Gupta
Website
Headquarters
New Delhi
Founded
1968
ISIN
INE878B01027
FIGI
BBG000F37TR6
KEI Industries Ltd. is engages in the business of manufacturing, selling, and marketing of all range of power cables. It operates through the following segments: Cable, Procurement, and Construction (EPC) Projects, and Stainless Steel Wire. The Cables segment includes low, high, and extra high voltage; control and instrumentation cables; specialty cables; elastomeric and rubber cables; submersible cables; flexible and house wires; and winding wires. The EPC Projects segment focuses on survey, supply of materials, design, erection, testing, and commissioning on a turnkey basis. The Stainless Steel Wire segment is involved in the manufacturing, selling, and provision of job work related to stainless steel wires. The company was founded in 1968 and is headquartered in New Delhi, India.
KEI INDUSTRIESKEI INDUSTRIES Will face resistance around 3250 and after consolidating it will fall down sharply, so wait watch observe and learn

KEI Industries | 51% Correction | Monthly POI Tapped | High Prob📉 Correction & Location Insight
All-Time High: ₹5,039
Current Low: ₹2,424
✅ Correction from Top: ~51%
✅ Price has now entered a Monthly Point of Interest (POI) after taking liquidity and showing reaction.
This level is crucial as the price has dropped significantly and is now tapping into a majo

stage analysis of KEIStage Analysis is a technical analysis method developed by Stan Weinstein, which categorizes a stock's lifecycle into four distinct phases

KEI INDUSTRIES - Short Term Trade Setup with Liquidity Grab!INDUSTRIES LTD today. This one’s looking interesting, with the stock currently in a consolidation phase , stuck between a supply zone and a demand zone . The best part? We’ve had a liquidity grab near the demand zone, which means the stock is back in a sweet spot for a potential move upwards.

KEI All Stage AnalysisKEI All Stage Analysis for stock analysis to be used for making a decision of probable uptrend and current state of the stock

KEI INDUSTRIES LTD S/R Support and Resistance Levels:
Support Levels: These are price points (green line/shade) where a downward trend may be halted due to a concentration of buying interest. Imagine them as a safety net where buyers step in, preventing further decline.
Resistance Levels: Conversely, resistance levels (re

ADD in Your Watchlist...NSE:KEI trade at 4630. Support is @ 4385 & Resistence is @ 4790.
on the daily chart time make a gap up breakout. you can wait for its fillup otherwise when it cross above 4790, its next resistence @ 5050 after that its on blue sky zone....

Kei industriesUptrend making HH hls
Rsi hidden bullish divergence with volumes showing continuation of uptrend going on
Rsi below 21 ema


See all ideas
Summarizing what the indicators are suggesting.
Neutral
SellBuy
Strong sellStrong buy
Strong sellSellNeutralBuyStrong buy
Neutral
SellBuy
Strong sellStrong buy
Strong sellSellNeutralBuyStrong buy
Neutral
SellBuy
Strong sellStrong buy
Strong sellSellNeutralBuyStrong buy
An aggregate view of professional's ratings.
Neutral
SellBuy
Strong sellStrong buy
Strong sellSellNeutralBuyStrong buy
Neutral
SellBuy
Strong sellStrong buy
Strong sellSellNeutralBuyStrong buy
Neutral
SellBuy
Strong sellStrong buy
Strong sellSellNeutralBuyStrong buy
Displays a symbol's price movements over previous years to identify recurring trends.
Related stocks
Frequently Asked Questions
The current price of KEI is 3,635.90 INR — it has increased by 0.26% in the past 24 hours. Watch KEI INDUSTRIES LTD. stock price performance more closely on the chart.
Depending on the exchange, the stock ticker may vary. For instance, on BSE exchange KEI INDUSTRIES LTD. stocks are traded under the ticker KEI.
KEI stock has risen by 2.61% compared to the previous week, the month change is a 19.45% rise, over the last year KEI INDUSTRIES LTD. has showed a −14.04% decrease.
We've gathered analysts' opinions on KEI INDUSTRIES LTD. future price: according to them, KEI price has a max estimate of 4,943.00 INR and a min estimate of 3,030.00 INR. Watch KEI chart and read a more detailed KEI INDUSTRIES LTD. stock forecast: see what analysts think of KEI INDUSTRIES LTD. and suggest that you do with its stocks.
KEI stock is 3.36% volatile and has beta coefficient of 1.30. Track KEI INDUSTRIES LTD. stock price on the chart and check out the list of the most volatile stocks — is KEI INDUSTRIES LTD. there?
Today KEI INDUSTRIES LTD. has the market capitalization of 337.40 B, it has increased by 0.94% over the last week.
Yes, you can track KEI INDUSTRIES LTD. financials in yearly and quarterly reports right on TradingView.
KEI INDUSTRIES LTD. is going to release the next earnings report on Aug 6, 2025. Keep track of upcoming events with our Earnings Calendar.
KEI earnings for the last quarter are 23.70 INR per share, whereas the estimation was 20.81 INR resulting in a 13.90% surprise. The estimated earnings for the next quarter are 18.59 INR per share. See more details about KEI INDUSTRIES LTD. earnings.
KEI INDUSTRIES LTD. revenue for the last quarter amounts to 29.15 B INR, despite the estimated figure of 27.40 B INR. In the next quarter, revenue is expected to reach 24.21 B INR.
KEI net income for the last quarter is 2.27 B INR, while the quarter before that showed 1.65 B INR of net income which accounts for 37.46% change. Track more KEI INDUSTRIES LTD. financial stats to get the full picture.
EBITDA measures a company's operating performance, its growth signifies an improvement in the efficiency of a company. KEI INDUSTRIES LTD. EBITDA is 9.77 B INR, and current EBITDA margin is 10.18%. See more stats in KEI INDUSTRIES LTD. financial statements.
Like other stocks, KEI shares are traded on stock exchanges, e.g. Nasdaq, Nyse, Euronext, and the easiest way to buy them is through an online stock broker. To do this, you need to open an account and follow a broker's procedures, then start trading. You can trade KEI INDUSTRIES LTD. stock right from TradingView charts — choose your broker and connect to your account.
Investing in stocks requires a comprehensive research: you should carefully study all the available data, e.g. company's financials, related news, and its technical analysis. So KEI INDUSTRIES LTD. technincal analysis shows the strong buy rating today, and its 1 week rating is buy. Since market conditions are prone to changes, it's worth looking a bit further into the future — according to the 1 month rating KEI INDUSTRIES LTD. stock shows the buy signal. See more of KEI INDUSTRIES LTD. technicals for a more comprehensive analysis.
If you're still not sure, try looking for inspiration in our curated watchlists.
If you're still not sure, try looking for inspiration in our curated watchlists.