DR LALPATH LABS - LONGNSE:LALPATHLAB Weekly outperforming stock with active buyers. May be continue bullish rally one to three weeks more.
LALPATHLAB trade ideas

Dr Lal Path Labs - LongNSE:LALPATHLAB Weekly cycle trade setup with macd crossover and buyers at locations.

LALPATH LAB - LONGNSE:LALPATHLAB Weekly positive chart setups and price will be break above 2750 closing zone.
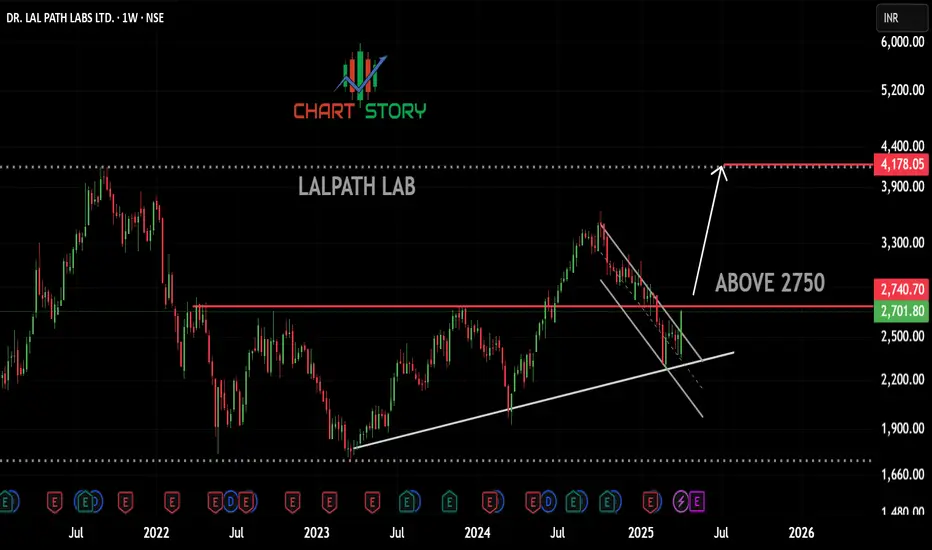
LALPATHLAB ready to Blast !!This is Weekly chart of LALPATHLAB
Stock is currently around law of Polarity
Stock has given no return from 2021 and currently given breakout around 2700
Stock has pending targets of 4000-4100 in weeks to come
Thank You !!

DR.LAL Path LABDR. Lal Path Lab
Trendline Breakout With Good Volume
RSI Above 60
Price Close Above EMA
Buy :- 3208
SL :- 2985
Target :- 3309 / 3356 / 3505 / 3605

DR. LAL PATH LABS LTD S/RSupport and Resistance Levels:
Support Levels: These are price points (green line/shade) where a downward trend may be halted due to a concentration of buying interest. Imagine them as a safety net where buyers step in, preventing further decline.
Resistance Levels: Conversely, resistance levels (red line/shade) are where upward trends might stall due to increased selling interest. They act like a ceiling where sellers come in to push prices down.
Breakouts:
Bullish Breakout: When the price moves above resistance, it often indicates strong buying interest and the potential for a continued uptrend. Traders may view this as a signal to buy or hold.
Bearish Breakout: When the price falls below support, it can signal strong selling interest and the potential for a continued downtrend. Traders might see this as a cue to sell or avoid buying.
20 EMA (Exponential Moving Average):
Above 20 EMA(50 EMA): If the stock price is above the 20 EMA, it suggests a potential uptrend or bullish momentum.
Below 20 EMA: If the stock price is below the 20 EMA, it indicates a potential downtrend or bearish momentum.
Trendline: A trendline is a straight line drawn on a chart to represent the general direction of a data point set.
Uptrend Line: Drawn by connecting the lows in an upward trend. Indicates that the price is moving higher over time. Acts as a support level, where prices tend to bounce upward.
Downtrend Line: Drawn by connecting the highs in a downward trend. Indicates that the price is moving lower over time. It acts as a resistance level, where prices tend to drop.
RSI: RSI readings greater than the 70 level are overbought territory, and RSI readings lower than the 30 level are considered oversold territory.
Combining RSI with Support and Resistance:
Support Level: This is a price level where a stock tends to find buying interest, preventing it from falling further. If RSI is showing an oversold condition (below 30) and the price is near or at a strong support level, it could be a good buy signal.
Resistance Level: This is a price level where a stock tends to find selling interest, preventing it from rising further. If RSI is showing an overbought condition (above 70) and the price is near or at a strong resistance level, it could be a signal to sell or short the asset.
Disclaimer:
I am not a SEBI registered. The information provided here is for learning purposes only and should not be interpreted as financial advice. Consider the broader market context and consult with a qualified financial advisor before making investment decisions.

lalpathlab buy swing /pos
now at 3329 buy near 3285
avg at 3250
sl 3215 2-3%
tgt 4%8%12%16%
buy near means 10+or- consider boz buyers zone

Dr Lal Pathlab (weekly Chart)Dr Lal Pathlab (weekly Chart)
Cup & Handle Pattern
Support 2767
Expected Level 3625 / 4245
RSI above 60 Daily / Weekly / Monthly
Volume Growth
PARMA / IT / FMCG / AUTO will continue to perform

Dr. Lal Path Lab Strong Bullish Momentum, Eyeing ₹3600On the weekly chart, Dr. Lal Path Lab stock is exhibiting a strong bullish trend, with solid upward momentum pushing the stock higher. Based on multiple RSI indicators, the stock remains above 60, signaling continued strength in the trend and positive buying pressure.
Key Technical Insights:
The stock is currently in a bullish phase and has broken key resistance levels, suggesting that it could continue its upward movement.
₹3249 is a major support level, providing a cushion for any potential short-term corrections and helping maintain the bullish bias.
Considering all technical indicators, the stock stands out as an excellent candidate for swing trading, with an expected target of ₹3600 during the October expiry.
Market Sentiment:
While the technical outlook for Dr. Lal Path Lab is highly favorable, a few external market factors could impact its trajectory:
Ongoing Middle East tensions may create volatility in global markets, including India.
FII outflows from the Indian stock market add an element of risk, as foreign investors are pulling back due to global uncertainties.
Conclusion:
Dr. Lal Path Lab presents a strong swing trading opportunity, with a target of ₹3600 in October. Despite broader market risks like geopolitical concerns and foreign investor outflows, the stock’s technical strength makes it a promising pick in the current environment.
Disclaimer: This is for educational purposes only and not financial advice. Please do your own research before making any investment decisions.

LALPATHLAB bullish flag buy side lalpathlab formed bullish flag on buy side. expecting good target. let's see

50 SMA Rising - Positional TradeDisclaimer: I am not a Sebi registered adviser.
This Idea is publish purely for educational purpose only before investing in any stocks please take advise from your financial adviser.
Its 50 SMA Rising Strategy. Suitable for Positional Trading Initial Stop loss lowest of last 2 candles and keep trailing with 50 days SMA if price close below 50 SMA then Exit or be in the trade some time trade can go for several months.
Be Discipline because discipline is the Key to Success in the STOCK Market.
Trade What you see not what you Think

Dr. Lal Path Labs Ltd. (NSE: LALPATH) - Daily Chart with FibonacThis chart illustrates a bullish breakout pattern in Dr. Lal Path Labs Ltd. on the NSE, analyzed on the daily time frame.
Key Technicals:
Fibonacci Levels: The Fibonacci extension tool is applied from the recent swing low around ₹3,278.85 to the swing high at ₹3,558.65.
1.618 Extension: ₹3,731.75
2.618 Extension: ₹4,011.85
Price Movement: The stock recently broke out of a consolidation pattern and is currently trading at ₹3,473.70, after hitting a high of ₹3,558.65.
Key Resistance Levels: The primary resistance level to watch is around the 1.618 Fibonacci extension at ₹3,731.75.
Support Level: The recent breakout level at ₹3,278.85 may act as support if the price retraces.
Market Sentiment:
The stock is showing strong upward momentum, with a potential to reach the higher Fibonacci extension levels if the bullish trend continues.
The breakout from the consolidation zone suggests a continuation of the uptrend, but traders should watch for any signs of reversal near the resistance levels.
Additional Information:
The chart includes a focus on the broader market sentiment, as reflected by other stocks in the watchlist that are showing mixed performance.
The volume indicator at the bottom shows an increase in buying activity, which supports the bullish case for further price appreciation.

LALPATHLAB - Long Above 2600LALPATHLAB - Can go Long above 2600 for half quantity and full quantity good candle close above 2700
In consolidation for last 2 years and inverse head and shoulder pattern in Weekly timeframe.
Stoploss - Mentioned in the Chart.
Target - TP1 and TP2 mentioned in the Chart.

Momentum Trading Picks - Dr.Lal Path LabsAs the chart clearly shows a breakout with the significant volume on a monthly time frame it's clear that we can see the great opportunity in the long side and since the market and sector both are in a bullish phase we can see the target will be achieved in no time.

This Dr might heal your portfolio in long termDr. Lal PathLabs Ltd. has shown significant price movement.
Recent Performance: The stock increased by 2.51%.
Support and Resistance Levels:
- Support: ₹2898.10
- Resistance: ₹3217.60
Moving Averages:
- 14 EMA: ₹2972.40
- 7 EMA: ₹2991.96
Key Financial Metrics:
- PE Ratio: 53.20
- EPS: ₹57.67
- Market Cap: ₹25,130 Crores
- Recent Earnings: FY 2023-2024 revenue ₹4,200 Crores, with PAT of ₹520 Crores
Entry, Exit, and Stop Loss:
- Entry Point: Above ₹3100 if signs of recovery are shown
- Exit Point: Near ₹3200 (resistance level)
- Stop Loss: At ₹2950
Disclaimer - Not a Buy/Sell Recommendation.

Dr. Lal Pathlabs Ltd. Breakout AlertDr. Lal Pathlabs Ltd. has shown a strong bullish breakout above previous resistance levels, indicating potential for upward movement. This breakout is supported by high trading volume, further validating the bullish trend.
Trade Setup:
🔴 SL: 2820
🟢 TP: 3100

LALPATH LAB READY to BOOMThe Stock was Consolidating with huge Volume accumulation as you can see from graph and now a good up move is possible.

#LALPATH - Inverse Head & Shoulder Breakout The top down approach.
1. Sector: Pharma is getting strong again with multiple names developing the moves. Look at #Thyrocare and #Alembic for example.
2. Book like chart: Picture perfect pattern on the chart is a bit rare to see. However, it doesn't really matter but still, makes it easy to spot from the crowd.
3. Volumes: This is a little area to still observe as we haven't seen the biggest of the bars yet.
4. Fundamentals: Growing sales, profit consistently. I am not an expert in this though.

Lalpathlab Changing the TrendStock is breaking out from its consolidation after 1 year.. we can plan the trade after crossing price of Rs. 2830.

SWING TUTORIAL - LALPATHLABNotice how the stock exactly revisited the most recent Swing High exactly after the Convergence Divergence.
MACD Cross after the Convergence Divergence gave a good entry as it happened at a Higher High Higher Low Pattern indicating a good move upward.
Eventually gave a 38% up move.
Another MACD Cross is under play currently. Can it break the Resistance zone of 2758 and go all the up to the next 3342 Support/Resistance zone?
Give your comments in the Comments Section below:

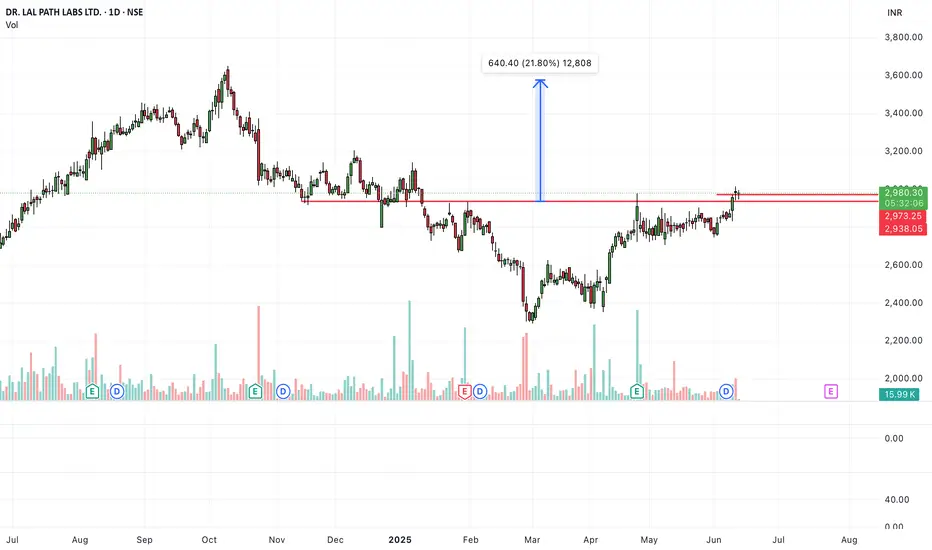
Dr Lalpath Lab LongNSE:LALPATHLAB Weekly positive head and shoulder with buyers. Macd shows long upward journey from here.

LALPATHLAB 1WBreak out has been started very recently.
.
.
.
.
.
.
I Am Not SEBI Registered Analyst. All Post and Levels Posting is only for educational and knowledge purpose. I Am not responsible for your any kind of loss or profit.
No Claim, All Rights Reserved.‼️
