LIC Swing TradeLIC is changing from Bearish to Bullish.
We can take the entry on a day closing above 1070.
The short-term target will be 1200 and it can reach 1450 before the end of the year.
Stop loss for the trade will be the day closing below 1000.
Let's See... NSE:LICI
LICI trade ideas

LIC- Swing trade-Inside bar breakout-Bullish NSE:LICI
16.07.2024
Buy: 1101
Target: 1163
Risk: Reward- 1:1
1. Inside candle breakout
2. Increased volumes in upmove. Good healthy bullish candles from few days
3. Previous resistances break and triple bottom formed
4. Prices above EMAs
5. Price consolidation from last 4 months
6. Price rejected from 50% Fibonacci level

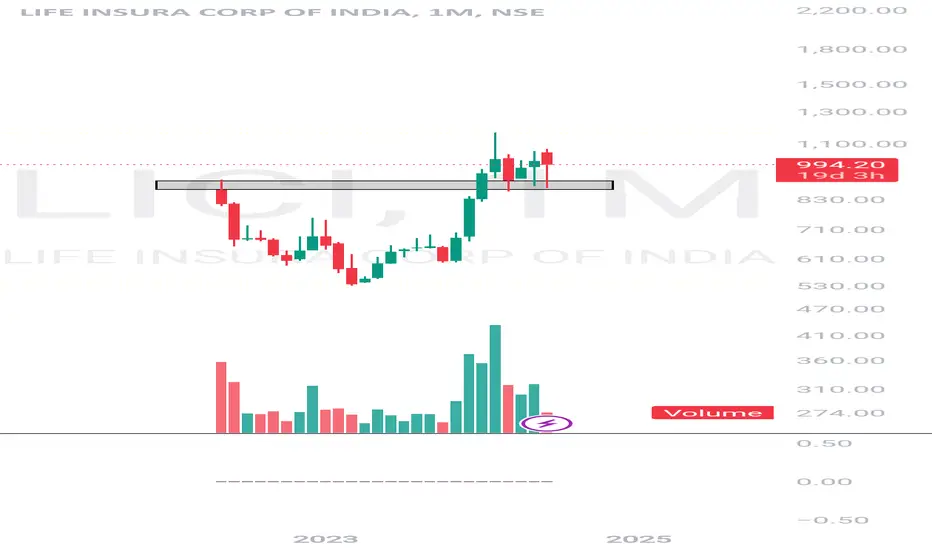
LICI Breakout!!!All Time High Breakout.
Box pattern Breakout.
Good Volume Buildup seen.
Accumulation Done.
Above all EMA.
Good for Short Term.
Do Like ,Comment , Follow for regular Updates...
Keep Learning ,Keep Earning...
Disclaimer : This is not a Buy or Sell recommendation. I am not SEBI Registered. Please consult your financial advisor before making any investments . This is for Educational purpose only.

LICI-LONGBullish trend in formation on LICI. Price action suggests further upside potential. Key support and resistance levels to watch. Consider long position with appropriate risk management.

LICIStock is consolidating from its life time high of 1175 since 9-FEB-2024. Multiple rejections in the range of 1060-1090.
due to market news and elections the stock is very volatile. I see the immediate support at 1000 and its a psychological level.. if this level is broken then the next strong support level is 867.
I suggest to exit the stock at 1080 levels and wait for accumulation zone 1000-950 levels (50% quantity) and 867-890 levels
Fibonacci levels suggest if the bullish trend continues then the targets 1081, 1175, 1213, 1345
if the stock price falls then the target levels are 1000, 961,898 & 835

LICLIC showing strength. gud bounce after touching daily 20 moving average. it has the potential to touch the all time high. and go further.
SL 744
it has gud potential for upside . Follow strict SL & Proper RISK REWARD RATIO. This is the only holy grail in the market.

LIC, Bull PennantPotential breakout from the Pennant,
Target at 1281, Stoploss at 929
Disclaimer : I am a aspiring swing trader, i have only started to learn to catch the pattern. So, please take this only as a idea

LICIBreakout of CnH can be seen,
next target is previous high and above that we may see another quick 10% move.

LIC* lic whel known company
* each cityzen know about company
* now it breakout with solid volume
* no recommendation for buy and sell
* only share my knowledge; no other
for more breakout details on chart

LICI breaking out after a long consolidationA good breakout after consolidating for 5 months in a range. Away from ATH by 6%. It could easily propel to 1300-1500 levels.

LIC S/R for 18/7/24Support and Resistance Levels: In technical analysis, support and resistance levels are significant price levels where buying or selling interest tends to be strong. They are identified based on previous price levels where the price has shown a tendency to reverse or find support.
Support levels are represented by the green line and green shade, indicating areas where buying interest may emerge to prevent further price decline.
Resistance levels are represented by the red line and red shade, indicating areas where selling pressure may arise to prevent further price increases. Traders often consider these levels as potential buying or selling opportunities.
Breakouts: Breakouts occur when the price convincingly moves above a resistance level (red shade) or below a support level (green shade). A bullish breakout above resistance suggests the potential for further price increases, while a bearish breakout below support suggests the potential for further price declines. Traders pay attention to these breakout signals as they may indicate the start of a new trend or significant price movement.
20 EMA: The yellow line denotes 20 EMA, to interpret the 20 EMA, you need to compare it with the prevailing stock price. If the stock price is below the 20 EMA, it signals a possible downtrend. But if the stock price is above the 20 EMA, it signals a possible uptrend.
Disclosure: I am not SEBI registered. The information provided here is for learning purposes only and should not be interpreted as financial advice. It is important to consult with a qualified financial advisor before making any investment decisions. Tweets neither advice nor endorsement.

LIC BUY..O I seeGood triangle breakout....tgt calculated as per pattern...Time roughly calculated..Triangle patterns breakout are fast running towards tgt...So buy

Life insurance corporation of indiaLife insurance corporation of India on daily chart analysis. Please share your valuable feedback.

LIC - Symmetrical Triangle Pattern Formation LIC Broke resistance of 16-Jan-24 and since the stock has taken one more support on same level. post that the stock is forming higher high , higher low and at the same time narrowing into Symmetrical Triangle Pattern. any breakout near 1000 will be start new uptrend for a possible target of 1250.

SWING IDEA - LICLife Insurance Corporation of India (LIC) , a leading insurance company, is exhibiting technical signals that suggest a promising swing trading opportunity.
Reasons are listed below :
1080 Zone Tested Multiple Times : The 1080 level has been a significant resistance zone. The price is now attempting to break through this level, indicating strong bullish momentum.
Bullish Marubozu Candle on Daily Timeframe : The recent formation of a bullish marubozu candle on the daily chart suggests strong buying pressure and potential for further upward movement.
Bullish Engulfing on Weekly Timeframe : The presence of a bullish engulfing candle on the weekly chart indicates a potential reversal in trend and strong buying interest.
Trading Above 50 and 200 EMA on Daily Timeframe : The stock is trading above both the 50-day and 200-day exponential moving averages (EMA), reinforcing the bullish sentiment and providing strong support levels.
Constant Higher Highs : The stock has been consistently making higher highs, indicating a strong uptrend and sustained bullish sentiment.
Spike in Volumes : A noticeable increase in trading volumes confirms the strength of the price move, indicating strong investor interest and participation in the current trend.
Target - 1170 // 1250
Stoploss - daily close below 990
DISCLAIMER -
Decisions to buy, sell, hold or trade in securities, commodities and other investments involve risk and are best made based on the advice of qualified financial professionals. Any trading in securities or other investments involves a risk of substantial losses. The practice of "Day Trading" involves particularly high risks and can cause you to lose substantial sums of money. Before undertaking any trading program, you should consult a qualified financial professional. Please consider carefully whether such trading is suitable for you in light of your financial condition and ability to bear financial risks. Under no circumstances shall we be liable for any loss or damage you or anyone else incurs as a result of any trading or investment activity that you or anyone else engages in based on any information or material you receive through TradingView or our services.
@visionary.growth.insights

LIC will boom boomThe rounding bottom structure's breakout has been completed and new rally is on the way
LIFE INSURA CORP OF INDIA S/RSupport and Resistance Levels: In technical analysis, support and resistance levels are significant price levels where buying or selling interest tends to be strong. They are identified based on previous price levels where the price has shown a tendency to reverse or find support.
Support levels are represented by the green line and green shade, indicating areas where buying interest may emerge to prevent further price decline.
Resistance levels are represented by the red line and red shade, indicating areas where selling pressure may arise to prevent further price increases. Traders often consider these levels as potential buying or selling opportunities.
Breakouts: Breakouts occur when the price convincingly moves above a resistance level (red shade) or below a support level (green shade). A bullish breakout above resistance suggests the potential for further price increases, while a bearish breakout below support suggests the potential for further price declines. Traders pay attention to these breakout signals as they may indicate the start of a new trend or significant price movement.
Disclosure: I am not SEBI registered. The information provided here is for learning purposes only and should not be interpreted as financial advice. It is important to consult with a qualified financial advisor before making any investment decisions. Tweets neither advice nor endorsement.

LIC - Price Action Breakdown!Overview & Observation:
1. Fakeout from demand zone (liquidity) after double bottom (W) formation.
2. Breakur & Retest done.
3. Earnings are unstable
Trade Plan:
I want to avoid any position in the stock right now mainly due to 2 major reasons:
1. RRR is not favourable. ( prices are already near the minor reversal level).
2. Price action limited.
3. No proper setup to trade!
- Stay tuned for further insights, updates and trade safely!
- If you liked the analysis, don't forget to leave a comment and boost the post. Happy trading!
Disclaimer: This is NOT a buy/sell recommendation. This post is meant for learning purposes only. Please, do your due diligence before investing.
Thanks & Regards,
Anubrata Ray

LICI: 600 on cards?The chart is self-explanatory as always :)
If you'd like to request an analysis, simply send us 100 coins as a token, and we'll be happy to post one for you.
⚠️Disclaimer: We are not registered advisors. The views expressed here are merely personal opinions. Irrespective of the language used, Nothing mentioned here should be considered as advice or recommendation. Please consult with your financial advisors before making any investment decisions. Like everybody else, we too can be wrong at times ✌🏻

Triangle pattern on LICILICI formed a triangle pattern on daily chart. Multiple support and resistance levels were tested with aggressive buyers seen in the last swing before the breakout. Also there was a spike in volume on breakout day indicating strong buyers out there. Stop loss can be held just below the breakout candle with target the width of the broader triangle. Risk reward is around 1:1.8
Hope you liked this idea, if so please boost this idea so others could benefit or leave a comment on what you think. I'll be glad to hear from you. Otherwise happy trading :-)

LICI 1DAY1. Good support and resistance
has observed
2. It looks like a symmetric triangle
candle formation tells it is bearish
I Am Not SEBI Registered Analyst. All Post and Levels Posting is only for educational and knowledge purpose .I Am not responsible for your any kind of loss or profit.
No Claim, All Rights Reserved.‼️

LICI Big race "Market Cap": "₹6,19,403Cr.",
"Current Price": "₹979",
"High / Low": "₹1,175/552",
"Stock P/E": "15.4",
"Book Value": "₹96.7",
"Dividend Yield": "0.41%",
"ROCE": "149%",
"ROE": "130%",
"Face Value": "₹10.0"

LICI - down trendLICI : M pattern
Expected down fall for 4-5%
Long term : Bullish
Note: Education purpose only.
