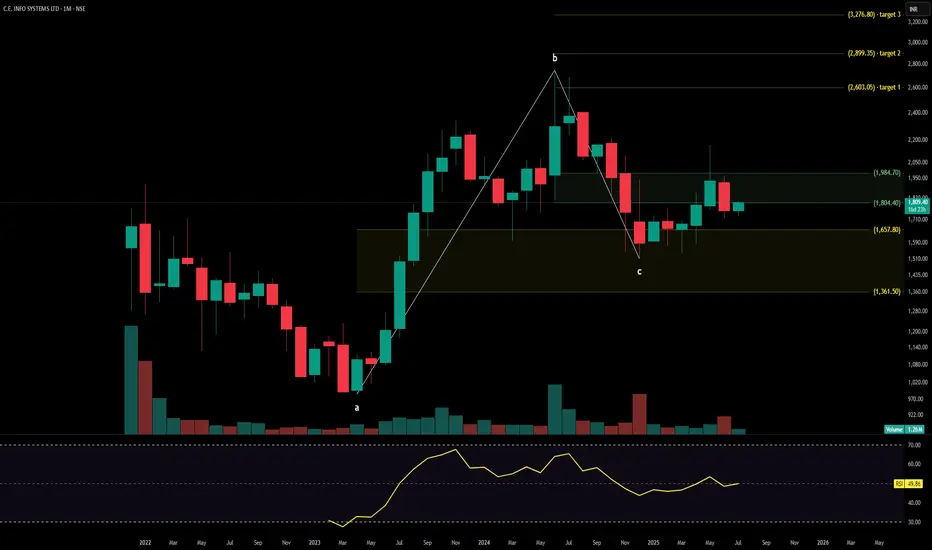
MAP MY INDIAC.E. Info Systems Ltd., operating under the brand MapmyIndia, is a leading geospatial SaaS and digital mapping company offering AI-powered mobility platforms, navigation tools, and automotive-grade telematics solutions. It serves marquee clients in automotive, logistics, government, and e-commerce verticals. The stock is currently trading at ₹1,804.40 and is forming a base post-correction, with early signs of trend reemergence supported by volume and Fibonacci alignment.
C.E. Info Systems Ltd. – FY22–FY25 Snapshot Sales – ₹215 Cr → ₹264 Cr → ₹314 Cr → ₹360 Cr – Consistent growth driven by SaaS subscriptions and automotive partnerships Net Profit – ₹89.3 Cr → ₹103.5 Cr → ₹116.2 Cr → ₹129.4 Cr – Steady margin profile with scalable revenue mix Company Order Book – Moderate → Strong → Strong → Strong – Expanding pipeline in mobility platforms and GIS services Dividend Yield (%) – 0.00% → 0.00% → 0.00% → 0.00% – No payouts, focused on reinvestment Operating Performance – Moderate → Strong → Strong → Strong – SaaS leverage driving operating margins Equity Capital – ₹10.71 Cr (constant) – Lean and efficient capital structure Total Debt – ₹0 Cr (debt-free) – Conservative balance sheet Total Liabilities – ₹185 Cr → ₹192 Cr → ₹204 Cr → ₹217 Cr – Stable, aligned with business scale Fixed Assets – ₹62 Cr → ₹68 Cr → ₹72 Cr → ₹78 Cr – Light capex structure supporting software stack
Latest Highlights FY25 net profit rose 11.4% YoY to ₹129.4 Cr; revenue increased 14.6% to ₹360 Cr EPS: ₹12.08 | EBITDA Margin: 31.2% | Net Margin: 35.94% Return on Equity: 25.28% | Return on Assets: 19.67% Promoter holding: 53.78% | Dividend Yield: 0.00% New deployments in EV navigation, autonomous mapping, and smart city platforms OEM integrations with leading automotive brands extending platform reach
Institutional Interest & Ownership Trends Promoter holding remains healthy at 53.78%, with no dilution or pledging. Recent quarterly filings show marginal uptick in FII interest, while mutual fund holdings remained steady. Delivery volume trends suggest accumulation by small-cap institutional trackers and thematic tech-focused portfolios.
Business Growth Verdict Yes, C.E. Info Systems is scaling sustainably with differentiated geospatial offerings Margins remain robust across product lines Zero debt and high ROE underscore financial discipline Asset-light model supports scalable growth with minimal capex needs
Company Guidance Management expects continued double-digit revenue growth in FY26, driven by expansion in automotive-grade maps, IoT platforms, and SaaS contracts. Profit margins are projected to stay above 30%.
Final Investment Verdict C.E. Info Systems Ltd. offers a unique play in India’s emerging deep-tech and mobility infrastructure ecosystem. With strong profitability metrics, zero debt, and expanding adoption across automotive and government platforms, the company is positioned for long-term value creation. Despite modest topline scale, its consistent margin profile and differentiated IP stack make it suitable for staggered accumulation by investors seeking niche tech exposure with high capital efficiency.
MAPMYINDIA trade ideas
CE INFO SYSTEMS LTD S/RSupport and Resistance Levels:
Support Levels: These are price points (green line/shade) where a downward trend may be halted due to a concentration of buying interest. Imagine them as a safety net where buyers step in, preventing further decline.
Resistance Levels: Conversely, resistance levels (red line/shade) are where upward trends might stall due to increased selling interest. They act like a ceiling where sellers come in to push prices down.
Breakouts:
Bullish Breakout: When the price moves above resistance, it often indicates strong buying interest and the potential for a continued uptrend. Traders may view this as a signal to buy or hold.
Bearish Breakout: When the price falls below support, it can signal strong selling interest and the potential for a continued downtrend. Traders might see this as a cue to sell or avoid buying.
MA Ribbon (EMA 20, EMA 50, EMA 100, EMA 200) :
Above EMA: If the stock price is above the EMA, it suggests a potential uptrend or bullish momentum.
Below EMA: If the stock price is below the EMA, it indicates a potential downtrend or bearish momentum.
Trendline: A trendline is a straight line drawn on a chart to represent the general direction of a data point set.
Uptrend Line: Drawn by connecting the lows in an upward trend. Indicates that the price is moving higher over time. Acts as a support level, where prices tend to bounce upward.
Downtrend Line: Drawn by connecting the highs in a downward trend. Indicates that the price is moving lower over time. It acts as a resistance level, where prices tend to drop.
Disclaimer:
I am not a SEBI registered. The information provided here is for learning purposes only and should not be interpreted as financial advice. Consider the broader market context and consult with a qualified financial advisor before making investment decisions.

MAPMYINDIA – Breakout Setup on Weekly Chart!🔹 Support: ₹1513, ₹1600
🔹 Resistance: ₹2343, ₹2747
🔹 Breakout Zone: ₹1750-1800
The stock is consolidating after a strong rally and forming a potential breakout setup. A move above ₹1750-1800 with volume can trigger a fresh rally.
🎯 Targets: ₹2340, ₹2740
📉 SL: ₹1510
Looks like a Stage 2 continuation if it clears resistance! 🚀
📌 Disclaimer: Not financial advice. DYOR.

MAPMYINDIAMAPMYINDIA stock price traded at support area, si it possible chances that it will move upper side. Target 🎯, marked on chart. Stop loss below daily closing of trend line.
This idea is for Educational purpose and paper trading only. Please consult your financial advisor before investing or making any position. Facts or Data given above may be slightly incorrect. We are not SEBI registered.

MAPMYINDIAMAPMYINDIA
DISCLAIMER : I am NOT a SEBI registered advisor or a financial adviser. All the views are for educational purpose only.

MAPMYINDIA : Building up for recovery MapMyIndia (CE Info Systems)
Corrective Wave C Completion: The price corrected to ₹1,446, forming a liquidity zone where buyers are likely to emerge.
Target Zone: Fibonacci retracement and prior highs suggest targets at ₹2,303-2,406.
Stop Loss Placement: Below ₹1,320, indicating a failure of buyer interest.
Trade Plan:
Entry: Buy between ₹1,446-1,500, aligning with the demand zone and the end of Wave C.
Target: Exit partially at ₹2,303 and fully at ₹2,406.
Stop Loss: Set at ₹1,320 to protect against downside risks.
Risk-Reward:
Risk (₹1,320): ₹126 below entry at ₹1,446.
Reward (₹2,303): ₹857 above entry.
R/R Ratio: 1:7 – an excellent swing trade setup.
Educational Tip: Corrections near Fibonacci levels (61.8%, 78.6%) often mark reversal points. Monitor price exhaustion signals like long wicks or bullish engulfing candles.
Final Thoughts: Follow your plan with discipline. Adjust trailing stop losses as the price moves in your favor. Always calculate R/R before taking any position.
Let me know if you need further refinements!

C.E. Info Systems Ltd. (Map my India) can be mapped by investorsC.E. Info Systems Ltd. or Map My India engages in the provision of digital map data, navigation, and tracking services. It offers GPS navigation devices, GPS navigation software products, store locators, vehicle tracking products, APIs for Internet or wireless LBS applications, print and digital maps, decision support systems, and utilities products. The firm also operates an internet portal for maps, directions, and local search.
Map my India CMP is 2162.50. The positive aspects of the company are Company with Low Debt, Company with Zero Promoter Pledge, Annual Net Profits improving for last 2 years and MFs increased their shareholding last quarter. The Negative aspects of the company are High Valuation (P.E. = 85), Stocks Underperforming their Industry Price Change in the Quarter and Declining Net Cash Flow : Companies not able to generate net cash.
Entry can be taken after closing above 2172 Targets in the stock will be 2289, 2395 and 2507. The long-term target in the stock will be 2631, 2688 and 2746. Stop loss in the stock should be maintained at Closing below 2030 or 1970 depending upon your risk taking ability.
Disclaimer: The above information is provided for educational purpose, analysis and paper trading only. Please don't treat this as a buy or sell recommendation for the stock. We do not guarantee any success in highly volatile market or otherwise. Stock market investment is subject to market risks which include global and regional risks. We will not be responsible for any Profit or loss that may occur due to any financial decision taken based on any data provided in this message.

SWING IDEA - MAPMYINDIA (C.E. INFO SYSTEMS)MapmyIndia (CE Info Systems) presents a compelling prospect for swing traders. Combining innovative technology with mapping solutions, MapmyIndia has established itself as a leader in the navigation and location-based services industry.
Reasons are listed below :
The 1600-1700 range, once a challenging barrier, has now transformed into a strong support level.
A Dragonfly Doji on the weekly timeframe hints at a possible reversal, underlining changing market dynamics.
The presence of a Bullish Marubozu candle on the daily chart signals sustained upward momentum, offering clear direction.
Supported by the 0.5 Fibonacci retracement level and the 50-period Exponential Moving Average (EMA) on the weekly chart, indicating a robust technical setup.
Stock has been consistently making higher highs, reflecting a trend of increasing bullish momentum.
A notable increase in trading volumes validates growing market interest, strengthening the bullish case.
Target - 2042 // 2250
Stoploss - weekly close below 1600
DISCLAIMER -
Decisions to buy, sell, hold or trade in securities, commodities and other investments involve risk and are best made based on the advice of qualified financial professionals. Any trading in securities or other investments involves a risk of substantial losses. The practice of "Day Trading" involves particularly high risks and can cause you to lose substantial sums of money. Before undertaking any trading program, you should consult a qualified financial professional. Please consider carefully whether such trading is suitable for you in light of your financial condition and ability to bear financial risks. Under no circumstances shall we be liable for any loss or damage you or anyone else incurs as a result of any trading or investment activity that you or anyone else engages in based on any information or material you receive through TradingView or our services.
@visionary.growth.insights

MAPMYINDIA - BULLISH SetupStock name - C.E. Info Systems Limited.
Weekly chart setup
Chart is self explanatory. Levels of breakout, possible up-moves (where stock may find resistances) and support (close below which, setup will be invalidated) are clearly defined.
Master Score - B
Disclaimer: This is for demonstration and educational purpose only. this is not buying and selling recommendations. I am not SEBI registered. please consult your financial advisor before taking any trade.

MAPMYINDIA - Rebound candidate!⚠️Disclaimer: We are not registered advisors. The views expressed here are merely personal opinions. Irrespective of the language used, Nothing mentioned here should be considered as advice or recommendation. Please consult with your financial advisors before making any investment decisions. Like everybody else, we too can be wrong at times ✌🏻

MAPMYINDIA Looking bullishmapmyindia looking bulish.go long with the target of t1-1944 t2-2094 and t3 2243 with the stop loss of 1687 (day close )

Map my India.It has given a breakout from inverted head and shoulder pattern. It has also move above its poc and avwap with good volumes n a marabuso candel. The stock if opens above last close can reume its uptrend

MAPMYINDIA - A stock to watchAfter a substantial down move to sub 200 MA level, the stock is bouncing back. Now it is crossing above the supply line. The Relative strength and Money Flow turning positive. Increasing Buying Pressure. Increase in Delivery volumes indicate some longer term interest. With a positive close above 1916 the stock will test the previous Rejection levels ( 2343-2200 )

MAP MY INDIAin this weak market scenario this stock is showing strength also it has touch its last ALL TIME HIGH and start buying from there. volume is also satisfying on buying candle .
sl will be same candle low 1866
Buy on some retracement for better risk reward.
First target will be 2280. then go in new range. as week buyers are out in this retracement.

MAPMYINDIA re entry?Entry triggered again, but did not re enter as was already scaled in other better performing stocks.
Lesson - Always have a pre defined number of stocks in which you will invest in at a particular time.

C.E INFO SYSTEMTriangle breakout retest. A close above today's high will ensure AVWAP squeeze breakout.

MAPMYINDIA break earlier high
retest earlier high level
volume growth
now level mentioned in chart
comment what is next level

MAP MY INDIADouble bottom confirmation on daily time frame. Break out candle is supported by gud volume. Also above all the key moving average.it can be gud buy.
sl 1140
taget near 1500

Long CE info system
Target will be 2300
According to ABCD pattern
Find AB
Point A is a significant low
Point B is a significant high
In the move from A up to B there can be no lows below point A, and no highs above point B
If AB, then find BC
Point C must be higher than point A
In the move from B down to C there can be no highs above point B, and no lows below point C
Point C will ideally be 61.8% or 78.6% of AB
In strongly trending markets, BC may only be 38.2% or 50% of AB
If BC, then draw CD
Point D must be higher than point B
In the move from C up to D there can be no lows below point C, and no highs above point D
Determine where D may complete (price)
CD may equal AB in price
CD may be 127.2% or 161.8% of AB in price
CD may be 127.2% or 161.8% of BC in price
Determine when point D may complete (time) for additional confirmation
CD may equal AB in time
CD may be 61.8% or 78.6% time of AB
CD may be 127.2% or 161.8% time of AB

CE INFO SYSTEMS LTD view for today 27th september Wednesday #MAPINTRADAY VIEW
CE INFO SYSTEMS LTD view for today 27th september Wednesday #MAPMYINDIA
Buying opportunity above 1805
Stop loss range below 1785
Follow strict risk reward and stop loss if you follow the level...
Charts for Educational purposes only.
Thanks,
V Trade Point

MAPMYINDIA : A reversal pattern is formingThe stock is trading at high valuations and in a market scenario in which even the overall market is showing signs of weakness, there is high probability for stocks with high valuation to sell-off.
The financial statements is not that attractive. And this adds upto the unfair valuation that the stock is trading now.
The FIIs have only a small percentage of holding in this stock and in the last 3 months they have decreased their holding by 2.59%. About 35.73% of the stock is held by retailers and other parties and a profit booking may easily lead to an aggressive panic selling in such scenarios.
So I will look for an entry only when the stock offers a fair valuation at the bottom of the expanding channel.


CE INFOSYSTEM (MAP MY INDIA)Double Bottom formation , price crossed above 200 EMA
cmp 1221 stoploss 1140 target 1409
