Equity Trade Setup – Marico Ltd. (NSE: MARICO)Trade Type: Momentum Breakout (Short-Term)
🔹 Trade Details
Buy Zone (Entry): ₹734.75 – ₹735.75
Current LTP: ₹736.80
Stoploss (SL): ₹727.00 (below swing low & 20 EMA)
Target (T1): ₹766.00
Target % Left: ~3.93%
🔍 Technical Indicators
📈 EMA Crossover: 9 EMA > 21 EMA > 50 EMA (bullish alignment)
📊 RSI: Near 60–65, with upward momentum (bullish)
🔺 Volume Surge: Confirming breakout from consolidation zone
✅ Client Advisory Summary
BUY MARICO LTD at ₹734.75–735.75 for a short-term breakout move.
Target: ₹766.00
Stoploss: ₹727.00
Timeframe: 1–3 Days
R:R Ratio: ~3:1
Confidence: High (based on EMA alignment, RSI strength, and volume confirmation)
For Education Purposes Only
MARICO trade ideas

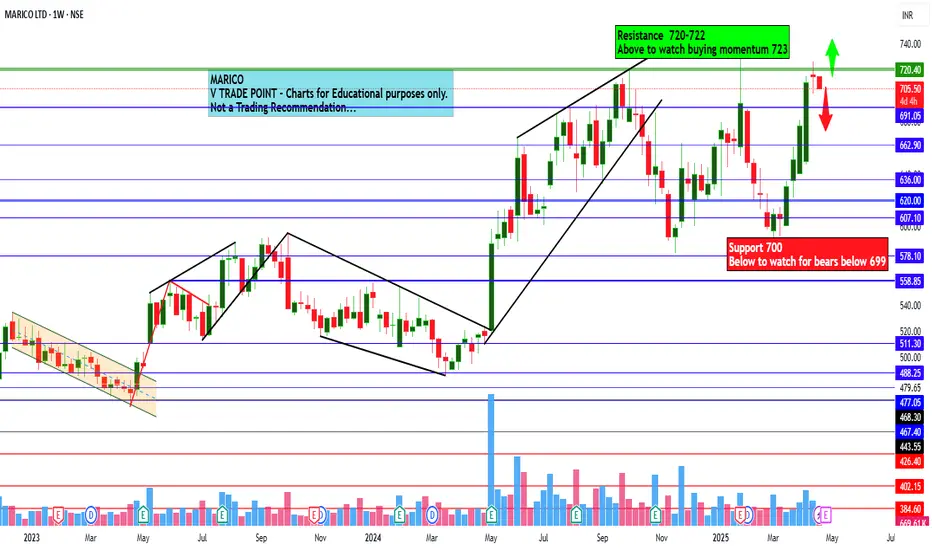
Marico Ltd view for Intraday 21st April #MARICOMarico Ltd view for Intraday 21st April #MARICO
Resistance 720-722 Watching above 723 for upside movement...
Support area 700 Below 710 ignoring upside momentum for intraday
Watching below 699 for downside movement...
Above 710 ignoring downside move for intraday
Charts for Educational purposes only.
Please follow strict stop loss and risk reward if you follow the level.
Thanks,
V Trade Point
Bearish on Marico CMP 610 , 06.03.2025Hello traders,
Hope you are doing well
Here is my new study on marico, i am bearish on marico with first target of 560 and final target of 530
This study is only for information and education purpose, please consult your investment advisor before making any investment.

MARICO | Buy @LTP with SL below 630 | Target 700Disclaimer:
This is not financial advice. Please do your own research or consult with a financial advisor before making any investment decisions. Investments in stocks can be risky and may result in loss of capital.

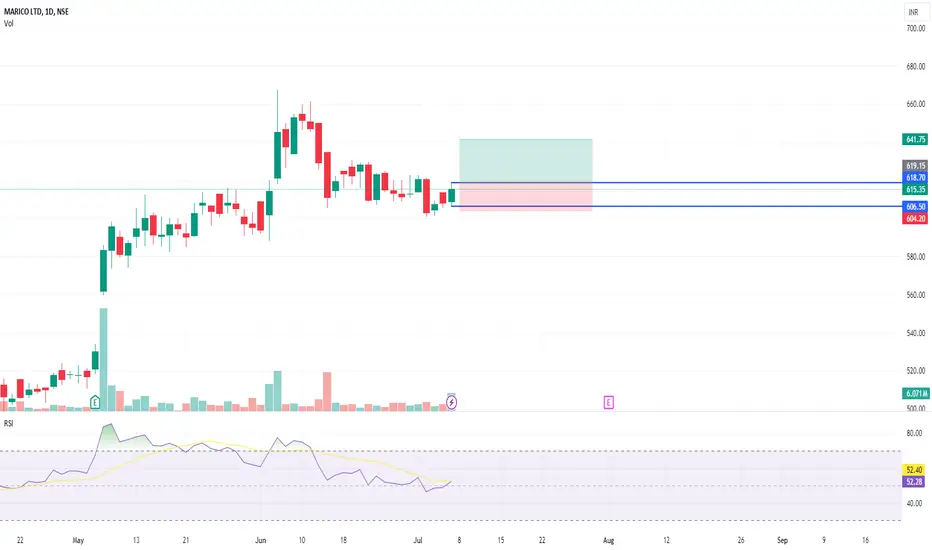
Marico Share Analysis Hello friends
Here is simple analysis for Marico share on Daily timeframe.Price breakout today daily range near 645-650 , and also break of trend line.Market is also looking bullish for next week so a nearly target of 710 looks achievable in next week.

Marico Ltd view for Intraday 22nd Nov #MARICO Marico Ltd view for Intraday 22nd Nov #MARICO
Resistance 600. Watching above 601 for upside movement...
Support area 585. Below 590-592 ignoring upside momentum for intraday
Support 585 Watching below 583 for downside movement...
Resistance area 600
Above 592 ignoring downside move for intraday
Charts for Educational purposes only.
Please follow strict stop loss and risk reward if you follow the level.
Thanks,
V Trade Point

Marico Ltd view for Intraday 18th Nov #MARICO Marico Ltd view for Intraday 18th Nov #MARICO
Resistance 600. Watching above 601 for upside movement...
Support area 590. Below 590 ignoring upside momentum for intraday
Support 590 Watching below 588 for downside movement...
Resistance area 600
Above 600 ignoring downside move for intraday
Charts for Educational purposes only.
Please follow strict stop loss and risk reward if you follow the level.
Thanks,
V Trade Point

Marico Analysis and projectionI have analyzed the high and low from recent time. Stop loss mentioned. And target is Apple.

Marico Ltd view for Intraday 7th October #MARICO Marico Ltd view for Intraday 7th October #MARICO
Buying may witness above 695
Support area 686-690. Below ignoring buying momentum for intraday
Selling may witness below 686
Resistance area 695
Above ignoring selling momentum for intraday
Charts for Educational purposes only.
Please follow strict stop loss and risk reward if you follow the level.
Thanks,
V Trade Point

Marico Ltd view for Intraday 4th October #MARICO Marico Ltd view for Intraday 4th October #MARICO
Buying may witness above 705
Support area 695-700. Below ignoring buying momentum for intraday
Selling may witness below 690
Resistance area 700
Above ignoring selling momentum for intraday
Charts for Educational purposes only.
Please follow strict stop loss and risk reward if you follow the level.
Thanks,
V Trade Point

MARICOMARICO LTD has consolidation breakout and TGT upto 20%
and this is just for educational purpose

Marico Looks good with decent RRMarico
Marico is breaking out it's levels and can be a good bet with decent RR ratio
Volume is the only issue as are not great
can be good and safe bet as infront of fed rate cut meeting and markets may be volatile

Marico Analysis: Getting ready for Breakout and ATHMarico is consolidating at time high. Breakout is on the cards - above 591.
All the levels are marked in chart.

Marico on the Verge of a Breakout!➡️ Resistance at ₹692.10 - Bullish Breakout Expected
➡️ Strong support from the ascending trend line

Marico Ltd view for Intraday 11th September #MARICO Marico Ltd view for Intraday 11th September #MARICO
Buying may witness above 685
Support area 670. Below ignoring buying momentum for intraday
Selling may witness below 670
Resistance area 685
Above ignoring selling momentum for intraday
Charts for Educational purposes only.
Please follow strict stop loss and risk reward if you follow the level.
Thanks,
V Trade Point

Marico can make merryMarico Limited, headquartered in Mumbai, Maharashtra, carries on business in branded consumer products. Marico manufactures and markets products with the brands such as Parachute, Parachute Advanced, Nihar, Nihar Naturals, Saffola, Hair & Care, Revive, Mediker, Livon, Set-wet, etc.
Marico Limited CMP is 665.25. The positive aspects of the company are Dividend yield greater than sector dividend yield, Company with Low Debt, FII / FPI or Institutions increasing their shareholding and MFs increased their shareholding last quarter. The Negative aspects of the company are High PE (PE=56.7), High promoter stock pledges and Promoter decreasing their shareholding.
Entry can be taken after closing above 668. Targets in the stock will be 682 AND 692. The long-term target in the stock will be 702 and 719. Stop loss in the stock should be maintained at Closing below 632 or 591 depending on your risk taking ability.
Disclaimer: The above information is provided for educational purpose, analysis and paper trading only. Please don't treat this as a buy or sell recommendation for the stock. We do not guarantee any success in highly volatile market or otherwise. Stock market investment is subject to market risks which include global and regional risks. We will not be responsible for any Profit or loss that may occur due to any financial decision taken based on any data provided in this message.

50 SMA Rising - Swing TradingI am not a Sebi registered adviser.
This Idea is publish purely for educational purpose only before investing in any stocks please take advise from your financial adviser.
50 SMA Rising strategy. Suitable for Swing Trading Initial Stop loss lowest of last 2 candles and keep trailing with 50 days SMA if price close below 50 SMA then Exit or be in the trade for 2 to 4 weeks.
Do not Forget to Exit is Stop loss Hit.
Be Discipline because discipline is the Key to Success in the STOCK Market.

Marico Ltd intraday level for 7th Aug #MARICO Marico Ltd intraday level for 7th Aug #MARICO
Buying may witness above 636
Support area 628-630. Below ignoring buying momentum for intraday
Selling may witness below 620
Resistance area 628-630. Above ignoring selling momentum for intraday
Charts for Educational purposes only.
Please follow strict stop loss and risk reward if you follow the level.
Thanks,
V Trade Point

3 year resistanceprice moving near 3 year resistance with high volume, currently stuck in range between 587-592, wherein 587 acting as strong support. High momentum could be expected above 608 and could reach 720 after breakout only. levels based on support and resistance only.
personal views, DYOR!

Review and plan for 9th July 2024Nifty future and banknifty future analysis and intraday plan in kannada. Stocks to watch included.
This video is for information/education purpose only. you are 100% responsible for any actions you take by reading/viewing this post.
please consult your financial advisor before taking any action.
----Vinaykumar hiremath, CMT

Go long - swing pick- this stock shows signficant delivery percentage value
- possible chances for accumulation
- may perform good in upcoming days
- line marked in chart is the day it showed huge delivery percentage.i consider it as signal candle.i marked its high and low
entry
- go long with 1:1.5 RR
- take entry if 15min close crosses the line , ignore entry if it made gap ups
- i prefer entry with in 5 days , if not triggered ignore this pick
sl
- candle close below signal candle's low
target
- keep 1.5 times of sl.
MARICO S/RSupport and Resistance Levels: In technical analysis, support and resistance levels are significant price levels where buying or selling interest tends to be strong. They are identified based on previous price levels where the price has shown a tendency to reverse or find support.
Support levels are represented by the green line and green shade, indicating areas where buying interest may emerge to prevent further price decline.
Resistance levels are represented by the red line and red shade, indicating areas where selling pressure may arise to prevent further price increases. Traders often consider these levels as potential buying or selling opportunities.
Breakouts: Breakouts occur when the price convincingly moves above a resistance level (red shade) or below a support level (green shade). A bullish breakout above resistance suggests the potential for further price increases, while a bearish breakout below support suggests the potential for further price declines. Traders pay attention to these breakout signals as they may indicate the start of a new trend or significant price movement.
Disclosure: I am not SEBI registered. The information provided here is for learning purposes only and should not be interpreted as financial advice. It is important to consult with a qualified financial advisor before making any investment decisions. Tweets neither advice nor endorsement.

stock selection 06-06-2024stocks in my watchlist to be traded today
uno minda
kpi green
torrentpharma
ptcil
endurance
