Mazdock LongMazdock
MTF Analysis
MazdockYearly Demand 1243
Mazdock 6 Month Demand 1245
MazdockQtrly Demand BUFL 1245
MazdockMonthly Demand 1245
MazdockWeekly Demand 2122
MazdockWeekly Supply 2608
MazdockDaily Demand DMIP 2021
ENTRY -1 Long 2021
SL 1930
RISK 91
Target as per Entry 2608
Positional Target 4041
Target Points 587
Recent High 2,930
Recent Low 1,920
MAZDOCK trade ideas

Mazagaon Dock 1 d Bullish momentum
Breakout of resistance
Volume built up
RSI >60
Breaking previous Week price
bullish Momentum
Making higher high

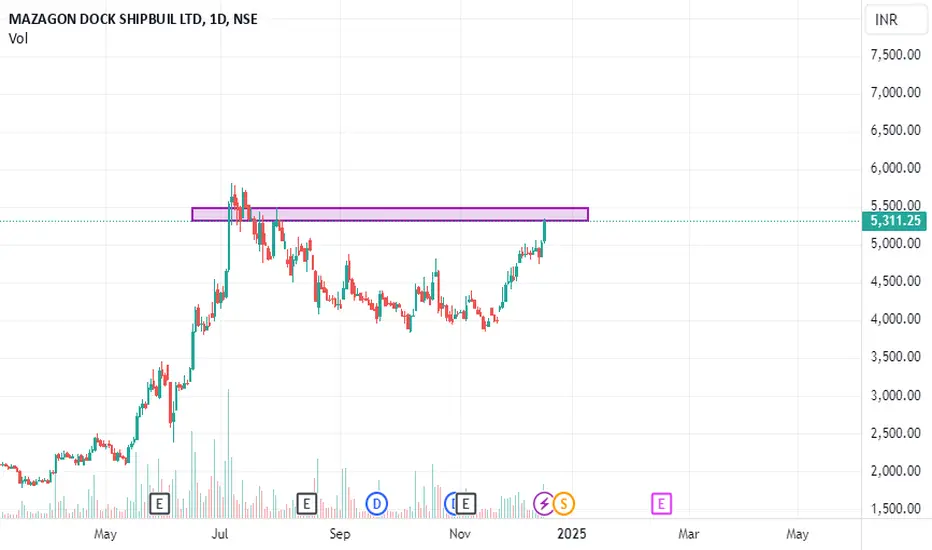
Mazdock at ResistanceMazdock stock is trading at Resistance.
wait for breakout or fallback from the resistance.
only for education purpose only.
Flag and pole pattern, along with W pattern breakout.This setup is exceptionally strong. Quant and ITI Mutual Funds entered in November, along with 37 other mutual funds that increased their holdings during the month. Good luck.

MAZDOCKDisclaimer:
This is not financial advice. Please do your own research or consult with a financial advisor before making any investment decisions. Investments in stocks can be risky and may result in loss of capital.


MAZDOCK - Breakout📈 MAZDOCK Breaking Out of a Falling Wedge! 🚀
#MAZDOCK! The stock has just broken out of a classic falling wedge pattern, signaling potential bullish momentum. Falling wedges are often considered reversal patterns, and this breakout could indicate a strong upward trend.

POV : MAZDOCK : Is ready to rock again ?POV : MAZDOCK : MAZAGON DOCK SHIPBUIL LTD
Is ready to rock again ?
Chart Reading:
1. Took Support at 0.5 FIB Level
2. at the Fib Level create a kind of Double Bottom pattern
3. Closing Base Trend Line break on 10th Oct and then after face resistance at another High base trend line(red).
4. in the previous session, try to breakout fractal high but selling pressure clearly seen.
5. Recent fractal high break with Marubozu Candle and also close above previous session High.
? Upcoming session will it break trend line
if it is then action plan will execute else waiting...
For educational purposes only. This is not financial advice. Please consult a professional before making financial decisions.
#NiVYAMi

MAZDOCK NSE BULLISH FLAG DTF/WTF 3.5M BO Soon. POSITIONAL TRADEMAZDOCK STOCK Analysis
TRADE PLAN
ENTRY -4518 50% Qty, Add 50% qty 4925 DTF Close
SL -3970
TARGET --01-5800 , TGT02--7600
Hold For a 1-2 Year or TGT 2
Chart Pattern :
STOCK had a 3Month Streak to Touch an ATH of 5860, Retracing in Equal time to 50% FIBO Level forming a Bullish Flag Pattern.
INDICATORS EMA :
The Price is Currently Trading above 50EMA, and 20EMa below 50EMA in DTF. STOCK EMAs are currently in Transitional stage of alignment where today an 8%+ price rise with Volumes indicating start of a bullish Trend on DTF/WTF.
FIBO E :
Currently the price is below 50% FIBO Retracement Level, Early Entry can be take as per your risk ability. Safe Traders Enter above 4925.
Volumes: There is a uptrend in Volume on the Weekly Charts for1 Weeks after the 14 weeks Pullback.
Keep in your Priority Watch List
Disclaimer: For Education/Reference Purpose Only, Trade at your Own Risk with correct position sizing and SL based on your Risk apetite (Exit when price closes 7to8% below your Entry).
Trail Your SL progressively. Learn/Know and Review the Stock trading Technical Terminology. Check Verify the Financial fundamentals of the Stock and Seek Advice from a Certified Financial Advisor prior to Investing. Prefer Entry with 25% quantity, Add in Tranches of 25%-50% as prices moves upwards recommended.
MTFA- Multiple Time Frame Analysis
DTF -Daily Time Frame
WTF-Weekly Time Frame
MTF- Monthly Time Frame
ATH-All Time High
LTH -LifeTime High
RBC&H-Rounding Bottom Cup/Handle
BO- Breakout Close
EMA -Exponential Moving Average
FIBO R/E -Trend based Fibonacci Retracement/Extension
SL Stop Loss
TBD- To be Decided
CHoCH- Change of Character Bullish/Bearish
MSB/BOS -Break Out Structure
FVG Fair Value Gap
20VMA -20Volume Moving Average
SWING/POSITIONAL Trade

mazdock in buyDue to fundamental its near to growth stock
even though its a traditional business India gives important in ship sector
so this sector will be a GROWTH for next 5years
follow the chart

MAZDOCK Short Trade Smashes TP1—More Targets Await!MAZDOCK (15m time frame), Short Trade
Entry: ₹4,451.90
Current Price: ₹4,205.85
TP1 Hit, Waiting for Lower Targets
Key Levels:
Entry: ₹4,451.90 – Positioned after confirmation of bearish trend on the 15m time frame, supported by price moving below the Risological Dotted Trendline.
Stop-Loss (SL): ₹4,650.95 – Placed above recent resistance levels to manage risk in case of reversal.
Take Profit 1 (TP1): ₹4,205.85 – Already hit, confirming downward momentum.
Take Profit 2 (TP2): ₹3,807.75 – Next target, indicating further potential bearish continuation.
Take Profit 3 (TP3): ₹3,409.65 – Further downside target as selling pressure builds.
Take Profit 4 (TP4): ₹3,163.60 – Final target for extended bearish trend.
Trend Analysis:
The price has decisively broken below support and maintained its position under the Risological Dotted Trendline, confirming strong selling pressure. After TP1 was hit, the trade shows continuation of bearish momentum, with further targets likely to be reached as the trend develops.

MAZDOCKBreakout happend in this stock with rising 200dma and RS indicator is also showing strength.
Keep your risk and reward ratios according to your own preferance.
This is for educational purpose, do your own research before investing.

Mazagon Dock Chart analysisMazagon Dock Chart analysis on daily time frame. This stock has shown breakout and retest as well.
Please share your feedback and follow for more such charts.

Mazdock !! upside rally started post healthy correctionMazdock !! upside rally started post healthy correction
- Falling wedge pattern breakout
- Volume Support

MAZDOCK Breaks Downtrend Channel After Securing Major OrderMazagon Dock Shipbuilders Ltd (NSE: MAZDOCK) has shown a strong price action today, breaking out of the downward trend channel after securing a significant order worth ₹1.22 billion from Maharashtra State Power Generation. This news has spurred bullish sentiment, driving the stock up by +4.55% to ₹4,472.40.
Technical Insights:
Downtrend Channel Breakout: The stock has successfully broken out of the descending channel that has been intact since early July, signaling a potential reversal of the downtrend.
Key Support Levels: The stock bounced from a strong support level at ₹4,248.30, which held firm despite recent downward pressure.
Resistance Levels : Immediate resistance lies at ₹4,714.40, where the stock previously faced selling pressure in late September. A breakout above this level could push the stock towards ₹5,147.20 and then ₹5,555.05.
Volume and Momentum: The recent price surge is accompanied by increased volume, suggesting that the bullish move is supported by strong buying interest. RSI is moving upward, currently near 60, indicating room for further upward movement before overbought levels are reached.
Fundamental Catalysts : The order from Maharashtra State Power Generation strengthens Mazagon Dock’s business outlook, providing long-term revenue visibility and boosting investor confidence.
Outlook: If the stock manages to sustain above ₹4,248.30, it could see further upside in the short-to-medium term, targeting the next resistance at ₹4,714.40 and beyond. However, a failure to hold above this breakout level may see the price retest support around ₹4,000.

Rebound to an all-time high.A strong breakout with healthy volumes, looks poised to retest its previous high. This is an excellent entry point, as both time and price corrections seem to be complete.

MAZAGON DOCKS - ON A RECOVERY PATH ?The stock after a buying climax bar in the month of July was overwhelmed with the supply of the BC bar and was pushed down to below the 50 DMA levels. Then it started accumulating around the 50 DMA and now it's finally getting pushed above the short-term moving averages. And all the key parameters like the relative strength, absolute strength, the money flow, buying pressure are all nicely stacked up favouring further up move. So, this could move up again. Another 1000 points testing 5400 levels. However, it is better to watch the next couple of bars to see if there is follow-up support coming.

MAZAGON DOCK S/R Support and Resistance Levels:
Support Levels: These are price points (green line/shade) where a downward trend may be halted due to a concentration of buying interest. Imagine them as a safety net where buyers step in, preventing further decline.
Resistance Levels: Conversely, resistance levels (red line/shade) are where upward trends might stall due to increased selling interest. They act like a ceiling where sellers come in to push prices down.
Breakouts:
Bullish Breakout: When the price moves above resistance, it often indicates strong buying interest and the potential for a continued uptrend. Traders may view this as a signal to buy or hold.
Bearish Breakout: When the price falls below support, it can signal strong selling interest and the potential for a continued downtrend. Traders might see this as a cue to sell or avoid buying.
20 EMA (Exponential Moving Average):
Above 20 EMA(50 EMA): If the stock price is above the 20 EMA, it suggests a potential uptrend or bullish momentum.
Below 20 EMA: If the stock price is below the 20 EMA, it indicates a potential downtrend or bearish momentum.
Trendline: A trendline is a straight line drawn on a chart to represent the general direction of a data point set.
Uptrend Line: Drawn by connecting the lows in an upward trend. Indicates that the price is moving higher over time. Acts as a support level, where prices tend to bounce upward.
Downtrend Line: Drawn by connecting the highs in a downward trend. Indicates that the price is moving lower over time. It acts as a resistance level, where prices tend to drop.
RSI: RSI readings greater than the 70 level are overbought territory, and RSI readings lower than the 30 level are considered oversold territory.
Combining RSI with Support and Resistance:
Support Level: This is a price level where a stock tends to find buying interest, preventing it from falling further. If RSI is showing an oversold condition (below 30) and the price is near or at a strong support level, it could be a good buy signal.
Resistance Level: This is a price level where a stock tends to find selling interest, preventing it from rising further. If RSI is showing an overbought condition (above 70) and the price is near or at a strong resistance level, it could be a signal to sell or short the asset.
Disclaimer:
I am not a SEBI registered. The information provided here is for learning purposes only and should not be interpreted as financial advice. Consider the broader market context and consult with a qualified financial advisor before making investment decisions.

Potential Upside for MazdockThe down phase is almost over.. Got new deals / orders. will reflect in next quarter.
Go LONG
Entry: 4450
Target: 7000
Stoploss: 3250
Disclaimer: Personal use only. Not an advice.


MAZAGON DOCKIt is a prominent shipyard in India. Initially a small dry dock, MDL has evolved into a renowned shipbuilding company. It has constructed 801 vessels since 1960, including warships, submarines, cargo/passenger ships, and offshore platforms.

Mazdock near monthly supportMazdock is currently trading near monthly support and its rsi is also in oversold area so swing traders or long traders may take their position for long or swing trading.

MAZDOCK to start a new rally soon!Where are the MAZDOCK fans!?
Mazdock went into correction a while back and all the Mazdock fans lost hope but it is back again with a bang!
