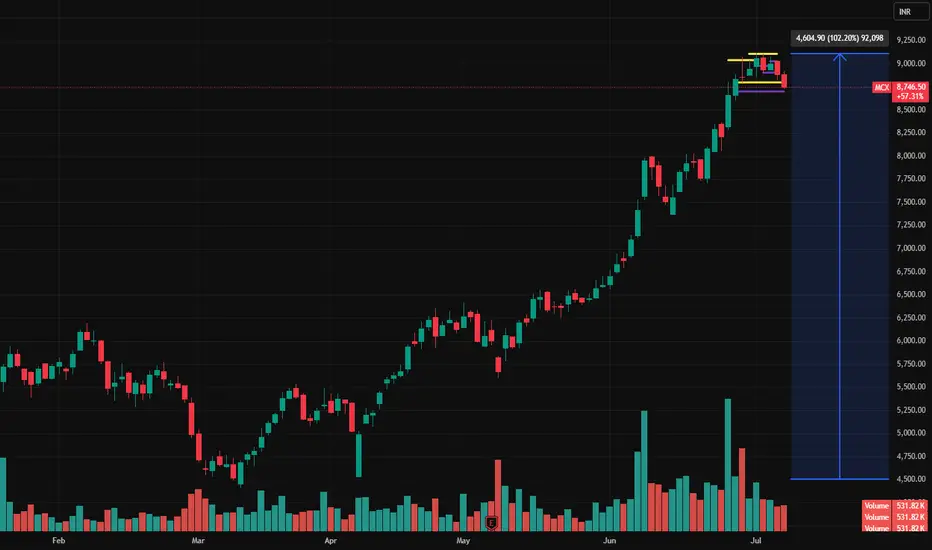
MCX Long_Support @ 20 DEMAMCX Long:
- price takes support at 20 DEMA
- Hidden Bullish divergence
- Enter when the price is favorable in the lower timeframe
- Earnings in 10 days
- SL: Close below 20 DEMA
- Target 9000
MCX trade ideas

MCX – Breakdown After Strong Rally | Bearish Setup AlertAfter a massive uptrend from April to June, MCX formed a distribution zone near the ₹9000 mark. The price consolidated in a narrow range and finally broke down below key support (~₹8745) with strong volume.
🔍 Technical Highlights:
Structure: Distribution after uptrend (UTAD possibility)
Breakdown candle closes below consolidation support
Volume spike confirms selling pressure
Price rejection from the ₹9100 resistance zone
Potential downside projection: ₹4600 (as per range height)
📉 Bearish Bias Active
Breakdown below ₹8745 is a short signal
SL: Above ₹8900 (last swing high)
Targets: ₹7800 → ₹7000
💡 Watch for retests, but this setup suggests possible deeper correction if the structure sustains.
🔻 Momentum fading... Bulls should be cautious.
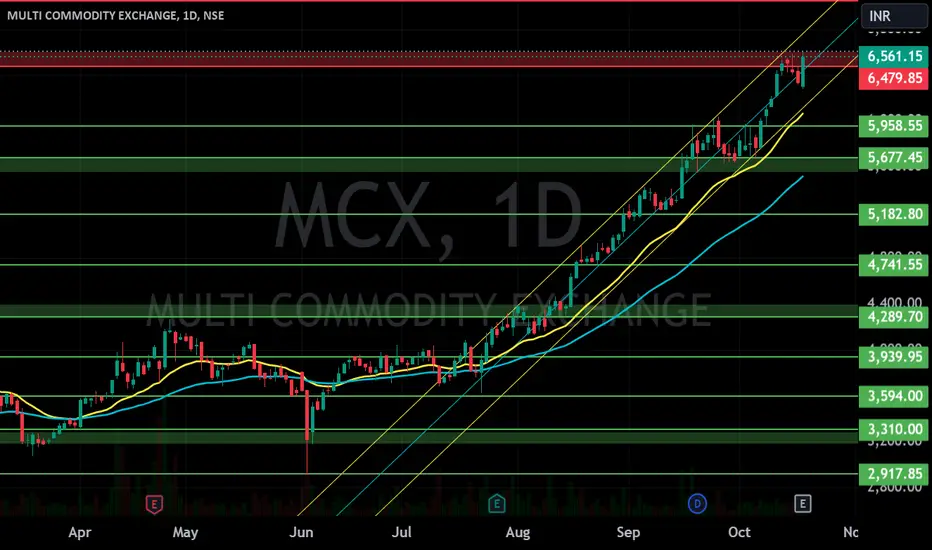
MCX - 5-Wave Impulse Complete, Correction Ahead?The recent price action in MCX has completed a 5-wave impulsive sequence, giving us valuable insights into potential upcoming moves.
The Larger Picture (Daily Timeframe) :
Starting from the prior major low, we have witnessed a clean impulse structure unfolding.
Wave 3 topped at 7,048.60, completing its previous impulse sequence.
Following this, a textbook ABC corrective structure unfolded into Wave 4, completing near 4,408.15. The internal symmetry within this ABC correction was near perfect, with Wave C nearly matching Wave A (100% projection).
Post Wave 4, the price resumed higher into Wave 5, where we now observe signs of completion.
Wave 5 Extension and Target Zone
Wave 5 extended strongly and has already entered its projected target zone:
100% projection of Wave 1 placed near 8,330.
1.618 extension projection reached near 8,922.
Ideal Correction Zones
Now that Wave 5 may have completed or is very close to doing so, we shift focus to probable retracement areas where price may find support in case of a corrective phase:
0.382 retracement at 6,853.50
0.5 retracement at 6,386.60
0.618 retracement at 5,919.65
Dynamic Update Note
The correction zones have been plotted based on the current observed Wave 5 high. Should Wave 5 extend further, these support levels will be recalculated accordingly. Traders are advised to keep monitoring for further price action confirmation before positioning.
The overall Elliott Wave structure here reflects the market may now enter a corrective phase as per standard wave behavior after a completed 5-wave advance.

MCX📌 Trade Setup Summary
Parameter Value
Entry 7145
Stop Loss (SL) 6252
Risk 893
Reward 2640
Target 9785
RR 3.0
This gives a favorable Risk-Reward Ratio (RRR) of 3.0, which aligns with high-quality trades.
The MCX (Multi Commodity Exchange) trade plan analysis you've shared reflects a strong bullish bias across all timeframes (HTF, MTF, and ITF). Here's a concise breakdown and interpretation:
🔍 Multi-Timeframe Analysis Summary
All trends are UP from Yearly to 60-Min charts:
✅ HTF (High Timeframe) Demand Zones
Strong demand seen from Yearly (3131 avg) to Quarterly (3945 avg).
HTF Average Demand Zone: 3674
✅ MTF (Mid Timeframe) Demand Zones
Zones progressively increasing:
📈 Technical Observations
Entry Point (7145) aligns with ITF demand—a strong confirmation.
Stop Loss (6252) is just below a significant weekly demand zone (6252–6706) — a reasonable buffer.
Target (9785) is near a probable supply zone (not shown), but represents RRR=3.
Recent High (7048) has been breached, suggesting momentum continuation.
🧠 Inference
All timeframe demand zones support a BUY bias.
You are entering at the edge of the intraday demand, which could lead to early breakout or minimal drawdown.
High conviction setup with:
Trend alignment ✅
Multi-zone confluence ✅
Attractive RR ✅
✅ Next Steps
Monitor price action near 7145 to ensure confirmation (e.g., bullish candle, volume spike).
Trail SL once price crosses 7048 to protect gains.
Keep an eye on market news or global commodities data impacting MCX sentiment.
Monthly Avg: 4377
Weekly Avg: ~5554 (includes higher demand zone at 6706–6252)
Daily Demand: 6970–6560
MTF Average: 5563
✅ ITF (Intraday Timeframe) Demand Zones
Tight cluster of demand at 7145–7057 (Avg: 7101)

MCX - Multi Commodity Exchange (45 minutes chart, NSE) - LongMCX - Multi Commodity Exchange (45 minutes chart, NSE) - Long Position; short-term research idea.
Risk assessment: Medium {volume structure integrity risk}
Risk/Reward ratio ~ 1.35
Current Market Price (CMP) ~ 6490
Entry limit ~ 6400 on May 16, 2025
Target limit ~ 6680 (+4.38%; +280 points)
Stop order limit ~ 6192 (-3.25%; -208 points)
Disclaimer: Investments in securities markets are subject to market risks. All information presented in this group is strictly for reference and personal study purposes only and is not a recommendation and/or a solicitation to act upon under any interpretation of the letter.
LEGEND:
{curly brackets} = observation notes
= important updates
(parentheses) = information details
~ tilde/approximation = variable value
-hyphen = fixed value

MCX - Multi Commodity Exchange (Daily chart, NSE) - LongMCX - Multi Commodity Exchange (Daily chart, NSE) - Long Position; short-term research idea.
Risk assessment: Medium {volume structure integrity & volatility risk}
Risk/Reward ratio ~ 4.25
Current Market Price (CMP) ~ 5930
Entry limit ~ 5925 to 5775 (Avg. - 5850) on April 25, 2025
1. Target limit ~ 6201 (+6%; +351 points)
2. Target limit ~ 6700 (+14.53%; +850 points)
Stop order limit ~ 5650 (-3.42%; -200 points)
Disclaimer: Investments in securities markets are subject to market risks. All information presented in this group is strictly for reference and personal study purposes only and is not a recommendation and/or a solicitation to act upon under any interpretation of the letter.
LEGEND:
{curly brackets} = observation notes
= important updates
(parentheses) = information details
~ tilde/approximation = variable value
-hyphen = fixed value

MCX possible to reach up to 4500 - To form Cypher / SharkMCX is on the verge to form Cypher / Shark with following targets possible
5400 - 5200 (200 EMA) - 4800 - 4700
In worst case it can go up to 4500 / 4200
Consider 5800 or 20 EMA is resistance / SL.

#MCX Spot Buy Setup🔼#MCX Spot Buy Setup
Last Close : 5541 , Buy Dip Till 5401 For The Target 5876—6244

MCX LONGMCX
MTF Analysis
MCXYearly Demand 3,344
MCX 6 Month Demand 4,270
MCXQtrly Demand BUFL 4,270
MCXMonthly Demand 6,035
MCXWeekly Demand 5,422
MCX240 M Demand 5,718
MCX DAILY Demand 5,689
ENTRY -1 Long 5,689.0
SL 6,165.0
RISK -476.0
Target as per Entry 8,584.0
RR -6.1
Last High 7,048.0
Last Low 5,512.0
ENTRY -2 Long 5,422.0
SL 6,165.0
RISK -743.0
Target as per Entry 8,584.0
Last High 7,048.0
Last Low 5,512.0

MCX 8% FALL?As we can see the stock has a made a good fall and has also broke the support and now its retesting so a next day red body will led to easy fall of 8%

MCX breakout?MCX breaking out
ATH
volume can be ssen as breakout given with big bullish candle
target upto 14%
buy above 6900
this is not buy sell advise. Prely my view and for educational purpose

MCX: A new beneficiary after regulationStrength looks pretty good. Even Relative Strength compared to Nifty.
CMP looks for good entry level, with day low for SL if you are interested in short term swing.
If you are interested in long term then maybe you should wait for a bit cheaper price, around swing low but it does not seem like it will reach soon. Better wait for good price if you are entering long term.

RETEST DONE NOW CONTUINING UPMOVE - MCX FOR YOUEverything is pretty much explained in the picture itself.
I am Abhishek Srivastava | SEBI-Certified Research and Equity Derivative Analyst from Delhi with 4+ years of experience.
I focus on simplifying equity markets through technical analysis. On Trading View, I share easy-to-understand insights to help traders and investors make better decisions.
Kindly check my older shared stock results on my profile to make a firm decision to invest in this.
For any query kindly dm.
Thank you and invest wisely.


TIME CORRECTOIN IS ONNow there might be seen price movement upside/downside by tomorrow onward in MCX.Last support zone will be demand zone if support voilated.

MCX S/R Support and Resistance Levels:
Support Levels: These are price points (green line/shade) where a downward trend may be halted due to a concentration of buying interest. Imagine them as a safety net where buyers step in, preventing further decline.
Resistance Levels: Conversely, resistance levels (red line/shade) are where upward trends might stall due to increased selling interest. They act like a ceiling where sellers come in to push prices down.
Breakouts:
Bullish Breakout: When the price moves above resistance, it often indicates strong buying interest and the potential for a continued uptrend. Traders may view this as a signal to buy or hold.
Bearish Breakout: When the price falls below support, it can signal strong selling interest and the potential for a continued downtrend. Traders might see this as a cue to sell or avoid buying.
20 EMA (Exponential Moving Average):
Above 20 EMA(50 EMA): If the stock price is above the 20 EMA, it suggests a potential uptrend or bullish momentum.
Below 20 EMA: If the stock price is below the 20 EMA, it indicates a potential downtrend or bearish momentum.
Trendline: A trendline is a straight line drawn on a chart to represent the general direction of a data point set.
Uptrend Line: Drawn by connecting the lows in an upward trend. Indicates that the price is moving higher over time. Acts as a support level, where prices tend to bounce upward.
Downtrend Line: Drawn by connecting the highs in a downward trend. Indicates that the price is moving lower over time. It acts as a resistance level, where prices tend to drop.
RSI: RSI readings greater than the 70 level are overbought territory, and RSI readings lower than the 30 level are considered oversold territory.
Combining RSI with Support and Resistance:
Support Level: This is a price level where a stock tends to find buying interest, preventing it from falling further. If RSI is showing an oversold condition (below 30) and the price is near or at a strong support level, it could be a good buy signal.
Resistance Level: This is a price level where a stock tends to find selling interest, preventing it from rising further. If RSI is showing an overbought condition (above 70) and the price is near or at a strong resistance level, it could be a signal to sell or short the asset.
Disclaimer:
I am not a SEBI registered. The information provided here is for learning purposes only and should not be interpreted as financial advice. Consider the broader market context and consult with a qualified financial advisor before making investment decisions.
MCX MCX is best breakout stock to trade or invest according to my analysis .Possible supports and resistances are mentioned here to watch.

MCX downside target 4600, 4500MCX may see a small decline after a big rise, from where MCX may again rise to new highs, for a short period a decline of 2 to 3 percent may be seen in MCX. Is. Our first target is Rs 4600.

Crude oil Indian market bullish view with minor correctionCrude oil bullish view with minor correction
You can wait to enter long term view there a minor 100 pips correction in 2-3 days and then a big leap towards 6900


MCX bullish; above 3985 ? - Friday 12th Apr.The above information does not constitute investment/trading recommendation and it is purely for educational purpose. Please check the Strategy below...
SWING Trading Strategy:
Position is created, only upon stock closing above the entry price on day closing basis and is held on for 5-10 trading sessions for larger gains (5-10%)
INTRADAY Trading Strategy:
1) Impulse upmove stage: The strong upmove (nearly upto 2% from breakoutprice) happens within five to 15 minutes. "High Risk Traders" buy in hope of another 2% upmove intraday.
"High Risk Traders" patiently wait through the Pullback-Consolidation stage to realize profits. High risk/High reward set up as breakouts may fakeout (reversal)also
2) Pullback-Consolidation stage: After the above "Impulse upmove stage"; the price may then pull back and move sideways (between "Open" price and "High" of the above "Impulse upmove stage").
Safe traders with minimum risk profile wait for a breakout from the consolidation to enter at this stage to relize high profits in the final intraday final "Breakout continuation" stage
3) Breakout continuation: Stocks often in the third stage breaks up above the "High" of the first "Impulse upmove stage" and continue to go higher again.
Both Safe Traders/High Risk Traders book profits at this stage
This do not constitute, financial, investment, trading, or other types of advice or recommendation.

F&O MasalaF&O Masala -
New Series - In this F&O Masala Series, I would like to share some good potential scrips.
Remember- this is for Educational Purpose & NOT a Buy or Sell Call.
Do you own Research (DYOR) before indulging into Buying/Selling.

MCX ready to run higher and higherBuy high and sell higher works when momentum is working one way. That seems to be the case for MCX right now. A classic bullish flag pattern breakoutThe stock is trading at highs but the momentum shows strength to soar higher
Entry - 3637
SL - 3445
Tgt - 3934
