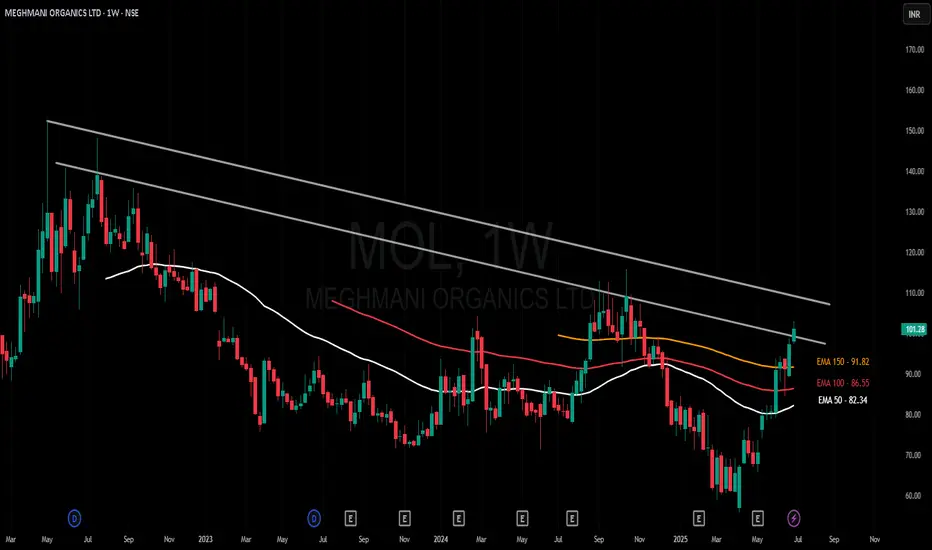
Amazing breakout on WEEKLY Timeframe - MOLCheckout an amazing breakout happened in the stock in Weekly timeframe, macroscopically seen in Daily timeframe. Having a great favor that the stock might be bullish expecting a staggering returns of minimum 25% TGT. IMPORTANT BREAKOUT LEVELS ARE ALWAYS RESPECTED!
NOTE for learners: Place the breakout levels as per the chart shared and track it yourself to get amazed!!
#No complicated chart patterns
#No big big indicators
#No Excel sheet or number magics
TRADE IDEA: WAIT FOR THE STOCK TO BREAKOUT IN WEEKLY TIMEFRAME ABOVE THIS LEVEL.
Checkout an amazing breakout happened in the stock in Weekly timeframe.
Breakouts happening in longer timeframe is way more powerful than the breakouts seen in Daily timeframe. You can blindly invest once the weekly candle closes above the breakout line and stay invested forever. Also these stocks breakouts are lifelong predictions, it means technically these breakouts happen giving more returns in the longer runs. Hence, even when the scrip makes a loss of 10% / 20% / 30% / 50%, the stock will regain and turn around. Once they again enter the same breakout level, they will flyyyyyyyyyyyy like a ROCKET if held in the portfolio in the longer run.
Time makes money, GREEDY & EGO will not make money.
Also, magically these breakouts tend to prove that the companies turn around and fundamentally becoming strong. Also the magic happens when more diversification is done in various sectors under various scripts with equal money invested in each N500 scripts.
The real deal is when to purchase and where to purchase the stock. That is where Breakout study comes into play.
Check this stock which has made an all time low and high chances that it makes a "V" shaped recovery.
> Taking support at last years support or breakout level
> High chances that it reverses from this point.
> Volume dried up badly in last few months / days.
> Very high suspicion based analysis and not based on chart patterns / candle patterns deeply.
> VALUABLE STOCK AVAILABLE AT A DISCOUNTED PRICE
> OPPURTUNITY TO ACCUMULATE ADEQUATE QUANTITY
> MARKET AFTER A CORRECTION / PANIC FALL TO MAKE GOOD INVESTMENT
DISCLAIMER : This is just for educational purpose. This type of analysis is equivalent to catching a falling knife. If you are a warrior, you throw all the knives back else you will be sorrow if it hits SL. Make sure to do your analysis well. This type of analysis only suits high risks investor and whose is willing to throw all the knives above irrespective of any sectoral rotation. BE VERY CAUTIOUS AS IT IS EXTREME BOTTOM FISHING.
HOWEVER, THIS IS HOW MULTIBAGGERS ARE CAUGHT !
STOCK IS AT RIGHT PE / RIGHT EVALUATION / MORE ROAD TO GROW / CORRECTED IV / EXCELLENT BOOKS / USING MARKET CRASH AS AN OPPURTUNITY / EPS AT SKY.
LET'S PUMP IN SOME MONEY AND REVOLUTIONIZE THE NATION'S ECONOMY!
MOL trade ideas
Short Swing Breakout - MOLShort Swing Breakout Observed in NSE:MOL along with Vol > 20 days Volume
1. Short Swing Breakout
2. Vol > 20 Days vol
3. RSI > 60
Entry - 114.74
Targets - t1 = 125, t1 = 134
SL 1 - RS 21 < 0
SL 2 - Super Trend 10, 3 turns negative

50 SMA Rising- Positional TradeDisclaimer: I am not a Sebi registered adviser.
This Idea is publish purely for educational purpose only before investing in any stocks please take advise from your financial adviser.
Its 50 SMA Rising Strategy. Suitable for Positional Trading Initial Stop loss lowest of last 2 candles and keep trailing with 50 days SMA if price close below 50 SMA then Exit or be in the trade some time trade can go for several months.
Be Discipline because discipline is the Key to Success in the STOCK Market.
Trade What you see not what you Think

MEGHMANI ORGANICS LTD - Rounding bottom with huge volumesRounding bottom with fresh volumes.
Targets(T1, T2 & T3) mentioned along with expected time frames. Stop loss marked as SL. Should carry trailing stop loss once in good gains.
Also keep tracking quarterly results to monitor performance.

meghmanihas begun commercial production of three insecticides, Dinotefuran, Ethiprole and Flonicamid, at its manufacturing facility at Dahej in Gujarat, India
The move will help the company expand its product basket to add more value-added products for the domestic and export markets.

MOL - 30% UPSIDE POSSIBILITIES MOL is striking the major supply zone.
It may retest the prvious supply zone from the level of 110-112.
All targets mentioned over the chart
Keep your SL tight

MOL if MOL's weekly candle closes above the resistance line, it may indicate a downtrend breakout.
Confirm the Breakout: A single weekly close above the resistance line might be an initial signal, but confirmation is essential. You may want to look for additional confirmation, such as:
A subsequent weekly candle that remains above the resistance level.
Increased trading volume, which can indicate strong interest and validate the breakout.
Disclaimer: This information is for educational purposes only and should not be considered as financial advice. Always conduct your own research or consult with a financial advisor before making trading decisions. Trading involves risk, and it's important to trade according to your risk tolerance and use proper risk management strategies.

ROUDING BOTTOM/ HEAD AND SHOULDDERS - MOLRounding Bottom/ Head and Shoulders Observed in MOL
1. RSI > 50
2. RS(NIFTY 50) > 0
ENTRY - 90.15
TGT - 103-105
SL - 83

Meghmani on the verge of breakout mega breakout?Meghmani Organics Ltd. operates as a diversified chemical company. It operates under the following segments: Pigment segment and Agrochemical segment.
Meghmani Organics CMP is 83.21. The positive aspects of the company are Company with Zero Promoter Pledge, Growth in Net Profit with increasing Profit Margin (QoQ), Stock with Low PE (PE = -20) and FII / FPI or Institutions increasing their shareholding.
The Negative aspects of the company are Degrowth in Revenue and Profit, Companies not able to generate net cash and Annual net profit declining for last 2 years.
Entry can be taken after closing above 84.5. Targets in the stock will be 93 and 96. The long-term target in the stock will be 100 and 105. Stop loss in the stock should be maintained at Closing below 71.
The above information is provided for educational purpose, analysis and paper trading only. Please don't treat this as a buy or sell recommendation for the stock. We do not guarantee any success in highly volatile market or otherwise. Stock market investment is subject to market risks which include global and regional risks. We will not be responsible for any Profit or loss that may occur due to any financial decision taken based on any data provided in this message.

Positional trade (nvestment) Educational purpose only It can be doubles in year
STrong fundamentals, low downside risk
for short term it can reach 100, 110 by march end

Megmani Organic Ltd Breakup Momentum - Bullish Targets UnveiledMegmani Organic Ltd (Ticker: MEGORG) has recently experienced a significant breakup with impressive trading volumes, signaling a potential bullish trend reversal. The stock is now poised for an upward trajectory, targeting key resistance levels at 101, 115, and 125.
Technical Analysis:
Breakup Confirmation: The breakup in Megmani Organic Ltd was accompanied by substantial trading volumes, indicating strong market participation and a potential shift in sentiment.
Supportive Candlestick Patterns: The recent breakup is supported by bullish candlestick patterns, suggesting increased buying interest and positive investor sentiment.
Moving Averages: Short-term moving averages (e.g., 20-day and 50-day) have crossed above long-term moving averages (e.g., 200-day), reinforcing the bullish momentum.
Potential Price Targets:
Target 1: 101
The first target represents a psychological resistance level and a potential breakout point.
Traders can consider taking partial profits at this level.
Target 2: 115
The second target indicates a further bullish move, with the potential to challenge previous highs.
Consider adjusting stop-loss levels as the stock approaches this target.
Target 3: 125
The third target signifies a more extended bullish move, with the stock aiming for new highs.
Traders may choose to reevaluate their positions and consider profit-taking strategies at this level.
Risk Management:
Stop Loss (SL): 78
A stop-loss level at 78 is recommended to mitigate potential losses in case of an unexpected reversal.
Adjust the stop-loss as the stock advances, locking in profits and managing risk accordingly.
Time Frame:
This trade idea is based on a mid-to-long-term outlook. Traders and investors should monitor the stock's performance regularly and adjust their positions as needed.
Disclaimer: This analysis is for educational purposes only and should not be considered financial advice. Traders and investors are encouraged to conduct their own research and seek professional advice before making any trading decisions. Trading involves risks, and past performance is not indicative of future results.

Postitional bet (education purpose only)Stocks is at strong support zone, retesting it.
Could give upto 30% upside gain.
SL below 50 EMA

MOL chart is looking good for long side. Keep SL at 77. Resistance marked on chart with horizontal line. Chart for education purpose only.

MOL Price currently rejecting off Weekly FVG.
Will wait for LTF Structure shift.
Tgt: Last week High.

MOLBo and retest.
Bo with good volume.
Company engaged in agro chemical and pigment.
Having strong R&D

MEGHMANI ORGANICS LTD - LONG TERM STOCK - MY VIEW ✅✅✅The Structure looks good to us, waiting for this instrument to correct and then give us these opportunities as shown on this instrument (Price Chart).
Note: Its my view only and its for educational purpose only. Only who has got knowledge about this strategy, will understand what to be done on this setup. its purely based on my technical analysis only (strategies). we don't focus on the short term moves, we look for only for Bullish or Bearish Impulsive moves on the setups after a good price action is formed as per the strategy. we never get into corrective moves. because it will test our patience and also it will be a bullish or a bearish trap. and try trade the big moves.
we do not get into bullish or bearish traps. We anticipate and get into only big bullish or bearish moves (Impulsive Moves). Just ride the Bullish or Bearish Impulsive Move. Learn & Know the Complete Market Cycle.
Buy Low and Sell High Concept. Buy at Cheaper Price and Sell at Expensive Price.
Keep it simple, keep it Unique.
please keep your comments useful & respectful.
Thanks for your support....
Tradelikemee Academy


[Positional Long] Meghmani Organics (MOL) BreakoutNSE:MOL has broken out after forming a nice long base. In terms of fundamentals, there doesn't seem to be any public news/reports but this week's volumes are highest ever and since it has broken out after a long slumber, it gives weightage to the view that stock might see significant upsides from here.
If this breakout sustains and price keeps above 200 DMA from current levels then next major resistance is around 142 which is a nice ~40% move from here. Difficult to say how long it might take though.

Long MOL for 164Bullish momentum with triangle breakout seen in MOL
Target 164 with SL below 114 DCB
CMP 125.5 Buy in dips till 118

[Basket] Meghmani Organics Buy IdeaNote -
One of the best forms of Price Action is to not try to predict at all. Instead of that, ACT on the price. So, this chart tells at "where" to act in "what direction. Unless it triggers, like, let's say the candle doesn't break the level which says "Buy if it breaks", You should not buy at all.
=======
I use shorthands for my trades.
"Positional" - means You can carry these positions and I do not see sharp volatility ahead. (I tally upcoming events and many small kinds of stuff to my own tiny capacity.)
"Intraday" -means You must close this position at any cost by the end of the day.
"Theta" , "Bounce" , "3BB" or "Entropy" - My own systems.
=======
I won't personally follow any rules. If I "think" (It is never gut feel. It is always some reason.) the trade is wrong, I may take reverse trade. I may carry forward an intraday position. What is meant here - You shouldn't follow me because I may miss updating. You should follow the system I share.
=======
Like -
Always follow a stop loss.
In the case of Intraday trades, it is mostly the "Day's High".
In the case of Positional trades, it is mostly the previous swings.
I do not use Stop Loss most of the time. But I manage my risk with options as I do most of the trades using derivatives.
=======

meghmani 1d buy cmp target 87.90,90, 93.75meghmani 1d buy cmp target 87.90,90, 93.75
sl 81.90
risk reward 2.43


