MOLD-TEK PACKAGING LTD S/RSupport and Resistance Levels:
Support Levels: These are price points (green line/shade) where a downward trend may be halted due to a concentration of buying interest. Imagine them as a safety net where buyers step in, preventing further decline.
Resistance Levels: Conversely, resistance levels (red line/shade) are where upward trends might stall due to increased selling interest. They act like a ceiling where sellers come in to push prices down.
Breakouts:
Bullish Breakout: When the price moves above resistance, it often indicates strong buying interest and the potential for a continued uptrend. Traders may view this as a signal to buy or hold.
Bearish Breakout: When the price falls below support, it can signal strong selling interest and the potential for a continued downtrend. Traders might see this as a cue to sell or avoid buying.
MA Ribbon (EMA 20, EMA 50, EMA 100, EMA 200) :
Above EMA: If the stock price is above the EMA, it suggests a potential uptrend or bullish momentum.
Below EMA: If the stock price is below the EMA, it indicates a potential downtrend or bearish momentum.
Trendline: A trendline is a straight line drawn on a chart to represent the general direction of a data point set.
Uptrend Line: Drawn by connecting the lows in an upward trend. Indicates that the price is moving higher over time. Acts as a support level, where prices tend to bounce upward.
Downtrend Line: Drawn by connecting the highs in a downward trend. Indicates that the price is moving lower over time. It acts as a resistance level, where prices tend to drop.
Disclaimer:
I am not SEBI registered. The information provided here is for learning purposes only and should not be interpreted as financial advice. Consider the broader market context and consult with a qualified financial advisor before making investment decisions.
MOLDTKPAC trade ideas

Mold-tek Packaging Limited Bullish RSI Divergence.Mold-tek Packaging Limited with Bullish RSI Divergence price getting Rejected at support wait for break of trend line with momentum to go long.

Moldtek packing for positional tradeThis is only for education purpose only. Please check your own analysis before you take a trade


Mold Teck Packing India Sun Storm Investment Trading Desk & NexGen Wealth Management Service Present's: SSITD & NexGen Portfolio of the Week Series
Focus: Worldwide
By Sun Storm Investment Research & NexGen Wealth Management Service
A Profit & Solutions Strategy & Research
Trading | Investment | Stocks | ETF | Mutual Funds | Crypto | Bonds | Options | Dividend | Futures |
USA | Canada | UK | Germany | France | Italy | Rest of Europe | Mexico | India
Disclaimer: Sun Storm Investment and NexGen are not registered financial advisors, so please do your own research before trading & investing anything. This is information is for only research purposes not for actual trading & investing decision.
#debadipb #profitsolutions

Mold-Tek Packaging Slow and SteadyCMP: 726
Target 1: 812
Target 2: 874
Thereafter, Ride the trend as long as the trend line is respected.
Seems to be in Wave 5 but time will tell if the graph needs to be readjusted since wave 4 was pretty short a dip.
ROCE ~ 19%
ROE ~ 17.5
Debt to Equity: 0.39 (Has been improving constantly for previous 5-6 quarters)
PEG: 0.37
PE: 35 (Vs Industry 14.7)
Holdings: Promoters: 35%, Institutions: 22.6% (Mutual Funds increased their holding by around 0.9%)
EBIT Growth (5 yrs) ~ 21%
Sales Growth YoY ~ 72%
Future Earnings Growth for Industry on Average. Mold-Tek is likely going to outperform this ~25% YoY
Despite Covid, net sales in FY 21 were up as opposed to FY 20 along with Net Profit.
Cashflow also increased by 15% last year.
PAT: ~ 194%. PBT also highest in last 5 quarters.
Quarterly Sales went down in June hence there was a drop but this quarter's projection are factored in hence it has been running like a horse.
Volumes Increasing Decently
Moving Average Daily Chart (5d, 20d, 50d, 100d, 200d): Bullish
Bollinger Bands: Bullish
MACD (Monthly): Bullish
RSI: Bearish
Insiders have been selling for last two quarters though they bought as well in the two quarters before that.

Bullish NSE:MOLDTKPACBuy = 515.65
SL = 497.65
Target 1 = 551.65
Target 2 = 569.65
13/09/2021
Bullish NSE:MOLDTKPAC-->Mold-Tek Packaging Ltd
Buy for short term

A pattern you would love to trade | S01e13This amazing share here gave a good consolidation breakout | | A triple layer parallel channel is broken for above
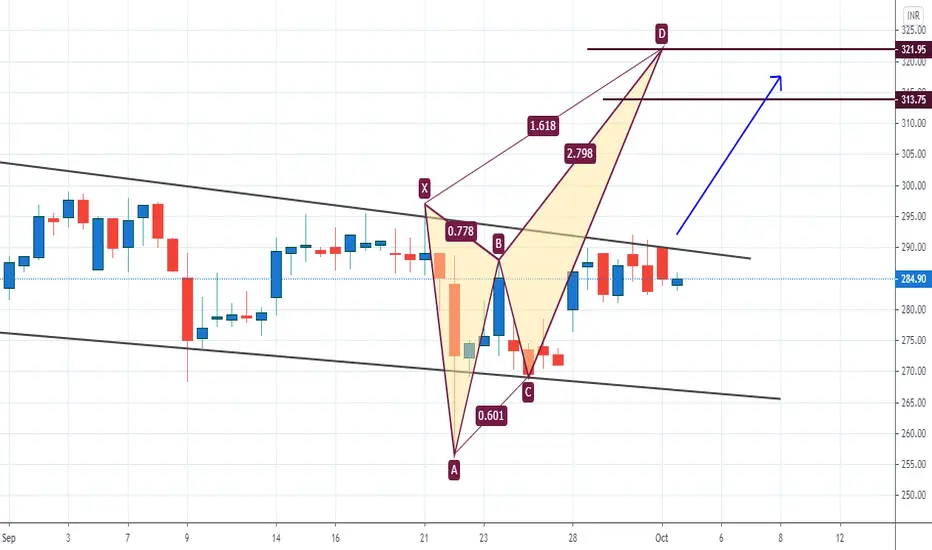
Pattern is good and a potential trade can be activated from here now will see what happens :)
Risk management is must :)

A Cup and Handle.Range contraction with shrinking volume and Inside weeks. A worthy candidate to track for breakout.

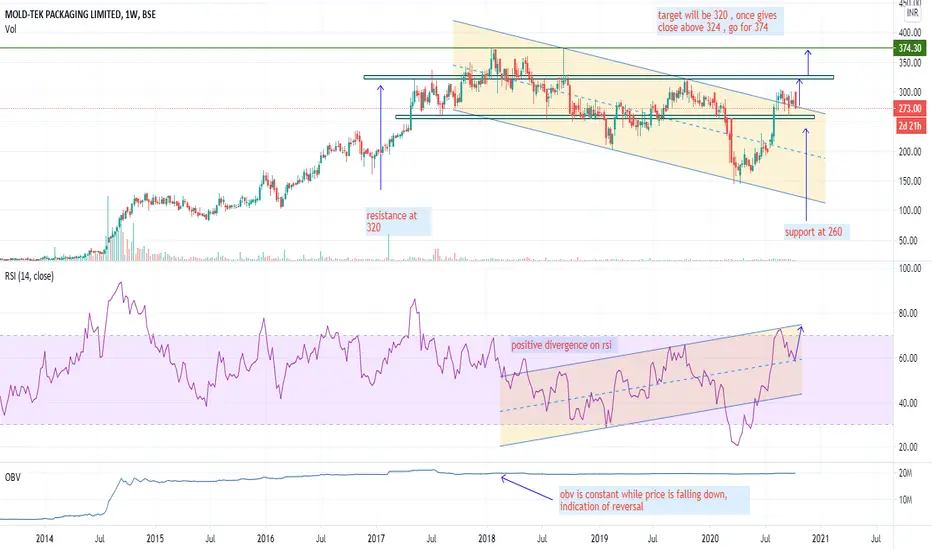
Mold tek expcted trajectoryBSE:MOLDTEK Expected to cover the bearish divergence with RSI
Also a wegde formation expected


MOLDTKPAC buy 304 Target 500Stock ready for Big Breakout buy CMP target 500 hold for 3-4 Months
EPS for Mold Tek Packaging Ltd has increased to ₹12.45 from ₹9.7
Ashish Kacholia buys 5.63 Lakhs shares of Mold Tek Packaging

