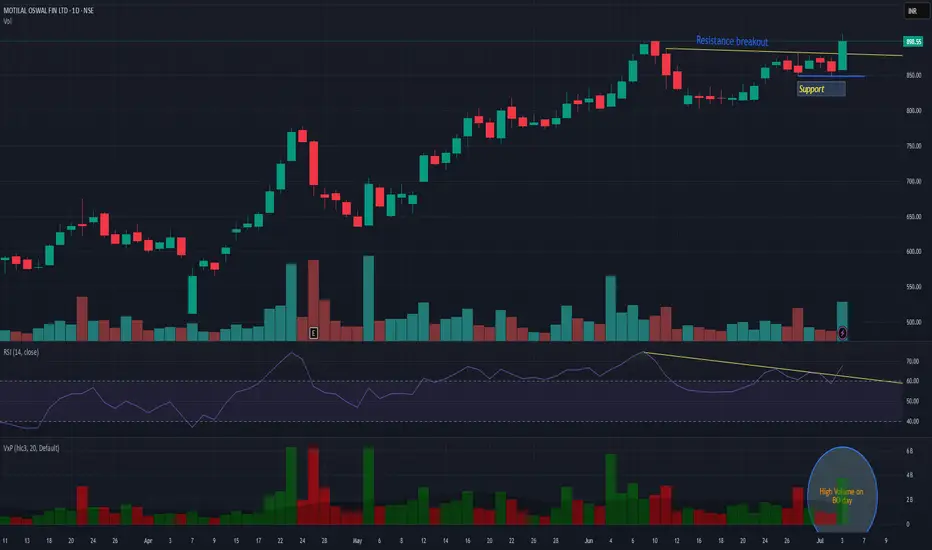
MOTILALOFSMOTILSLOFS has given resistance breakout with decent volume. Strong support can be seen near 845 levels. It may continue momentum rally till 1008. And if it sustain above that then it may do wonders! Keep it on radar.
MOTILALOFS trade ideas
breakoutStock is forming cup & handle.
- Above 0.5 fib & 200 DMA & AWAP
- Small resistance between 0.5 & 0.6 is at 822
- If sustain then go for 848 to 900+

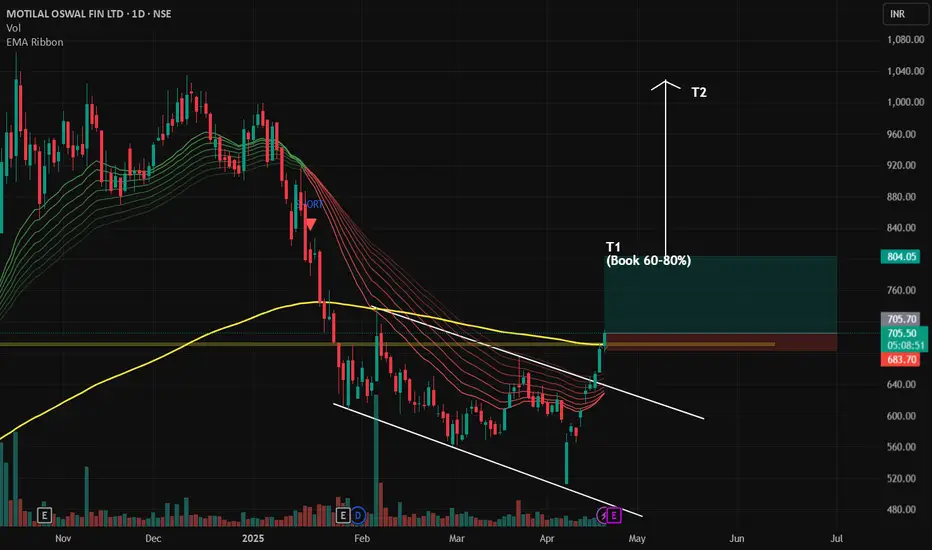
Recent Breakout from Downward Channel and Historic Support200 EMA crossover, Growing Strength in RSI, Breakthrough at Recent Support levels
T1 @800
T2 @1015
Motilal Oswal Surpasses Trendline and Resistance: A Buy Signal.?MOTILAL OSWAL shares have recently emerged from a prolonged downtrend, decisively breaking through the key resistance level of 700 rupees. Notably, the stock has successfully retested this threshold, a positive indicator of its potential for upward momentum.
At this juncture, it is crucial to monitor whether the stock can maintain its position above the 700 rupee mark. If it demonstrates stability at this level, there are two strategic entry points worth considering for potential investors. The first opportunity arises at the current price of 700 rupees, allowing for an entry that capitalizes on recent bullish momentum. The second entry point is contingent upon a breakout above a minor resistance level at 775 rupees. A breach of this level could signal increased buying interest and further price appreciation.
Our target for this bullish scenario is focused on the next significant resistance level at 880 rupees. Achieving this target could yield substantial returns for those who carefully time their entries and exits in the market. As always, it’s important to uphold rigorous risk management practices while navigating these trading decisions.

Motilal oswal trading is very crucial zone Motilal oswal trading is very crucial zone it can go up side as per the price action

Value Stock - Triangle pattern, Buy on DipsDouble Digit ROCE, ROE
PEG Ratio < 1
PE in buy zone
FII and DII presence
Technical: The Trendline Resistance is now a clear support. Current price is at Trendline support and 65 Day moving average creating a confluence. The Triangle pattern formation can lead to a bullish breakout and reach unknown territories.
Note: Only an analysis not a buy/sell recommendation.

MOTOLAL OSWAL1. Trend Analysis
The stock is in a clear uptrend, making higher highs and higher lows since mid-2023.
Momentum remains positive, with price trading above most key moving averages, indicating sustained bullish sentiment.
2. Support and Resistance Levels
Immediate Support Zones:
₹954.68: Close support from recent consolidation.
₹903.25: A stronger demand zone, as it aligns with prior breakout levels.
Major Resistance Levels:
The stock is currently trading near ₹1,012.50, which appears to be a potential resistance. Breaking above this could signal continuation of the uptrend.
Deeper Support Levels:
₹820.50 and ₹693.93: These zones could act as strong support during significant corrections.
3. Moving Averages
The stock is trading above short-, medium-, and long-term moving averages, which confirms the ongoing bullish sentiment.
The short-term EMA (20-day) is providing immediate support, reflecting strong near-term momentum.
4. Pattern Observations
A cup-and-handle pattern is visible between mid-2023 and late-2024. This is a bullish continuation pattern and suggests potential upside if the stock breaks above the handle resistance.
The breakout level for the handle seems to be around ₹1,012.50. A strong close above this point may initiate the next leg of the uptrend.
5. MACD Indicator
Current Status:
The MACD Line (25.64) is above the Signal Line (18.78), indicating strong bullish momentum.
Histogram: Positive and widening, which further supports the continuation of the uptrend.
6. Volume Analysis
There is evidence of higher volume spikes during rallies, indicating institutional buying.
Recent volumes appear lower during the consolidation phase, which is typical in an uptrend and signals no major selling pressure.
7. Key Levels to Watch
Upside Potential:
If the stock breaks above ₹1,012.50 with volume, it could head toward higher resistance zones.
Downside Risk:
A failure to hold ₹954.68 might lead to a pullback toward ₹903.25 or deeper toward ₹820.50.
8. Summary
Bullish Bias: The overall trend is positive, supported by strong technicals and patterns. Watch for a breakout above ₹1,012.50 for confirmation of the next leg upward.
Key Levels to Monitor:
Support: ₹954.68 and ₹903.25.
Resistance: ₹1,012.50.

MOTILALOFS - Head and Shoulder patternAll details are given on chart. If you like the analyses please do share it with your friends, like and follow me for more such interesting charts.
Disc - Am not a SEBI registered analyst. Please do your own analyses before taking position. Details provided on chart is only for educational purposes and not a trading recommendation

MOTILAL OSWAL FIN LTD S/RSupport and Resistance Levels:
Support Levels: These are price points (green line/shade) where a downward trend may be halted due to a concentration of buying interest. Imagine them as a safety net where buyers step in, preventing further decline.
Resistance Levels: Conversely, resistance levels (red line/shade) are where upward trends might stall due to increased selling interest. They act like a ceiling where sellers come in to push prices down.
Breakouts:
Bullish Breakout: When the price moves above resistance, it often indicates strong buying interest and the potential for a continued uptrend. Traders may view this as a signal to buy or hold.
Bearish Breakout: When the price falls below support, it can signal strong selling interest and the potential for a continued downtrend. Traders might see this as a cue to sell or avoid buying.
20 EMA (Exponential Moving Average):
Above 20 EMA(50 EMA): If the stock price is above the 20 EMA, it suggests a potential uptrend or bullish momentum.
Below 20 EMA: If the stock price is below the 20 EMA, it indicates a potential downtrend or bearish momentum.
Trendline: A trendline is a straight line drawn on a chart to represent the general direction of a data point set.
Uptrend Line: Drawn by connecting the lows in an upward trend. Indicates that the price is moving higher over time. Acts as a support level, where prices tend to bounce upward.
Downtrend Line: Drawn by connecting the highs in a downward trend. Indicates that the price is moving lower over time. It acts as a resistance level, where prices tend to drop.
RSI: RSI readings greater than the 70 level are overbought territory, and RSI readings lower than the 30 level are considered oversold territory.
Combining RSI with Support and Resistance:
Support Level: This is a price level where a stock tends to find buying interest, preventing it from falling further. If RSI is showing an oversold condition (below 30) and the price is near or at a strong support level, it could be a good buy signal.
Resistance Level: This is a price level where a stock tends to find selling interest, preventing it from rising further. If RSI is showing an overbought condition (above 70) and the price is near or at a strong resistance level, it could be a signal to sell or short the asset.
Disclaimer:
I am not a SEBI registered. The information provided here is for learning purposes only and should not be interpreted as financial advice. Consider the broader market context and consult with a qualified financial advisor before making investment decisions.

50 SMA Rising- Positional TradeDisclaimer: I am not a Sebi registered adviser.
This Idea is publish purely for educational purpose only before investing in any stocks please take advise from your financial adviser.
Its 50 SMA Rising Strategy. Suitable for Positional Trading Initial Stop loss lowest of last 2 candles and keep trailing with 50 days SMA if price close below 50 SMA then Exit or be in the trade some time trade can go for several months.
Be Discipline because discipline is the Key to Success in the STOCK Market.
Trade What you see not what you Think


MOTILALOFS potential breakout - 4 months base breakout
- Now consolidating outside base
- Volume contraction
- Surfing 9EMA
- Strong sector

Motilal Oswal: Strong growth potential with a target of ₹1,120+Motilal Oswal Financial Services Ltd, established in 1987, is a leading financial services firm offering a broad range of services, including broking, investment banking, asset and wealth management, and housing finance. With a strong presence across 550+ cities, the company caters to over 1.6 million customers.The company's robust financial performance and growth trajectory make it a compelling investment for the long term. NSE:MOTILALOFS
I bought at ₹728 with a stop loss below ₹670, targeting a potential upside between ₹1,120 and ₹1,650+.

#MOTILALOFS#Motilalofs #Stocks #StockInNews company has posted impressive results, continous improvement in the performance on QoQ and YoY. Stock was also making a base. Giving the trendline breakout now. let's see. It is near 0 Line. It is going to burst. CMP 577, My Target for the stock is 635/675, stop loss DCB 544. Good risk reward for short term.

MOTILALOFSMotilal oswal finance Ltd
CMP 677
Volume spurt on daily candle
Trying to break All time high third time
Good volume

MOTILAL OSWAL FIN LTD S/RSupport and Resistance Levels:
Support Levels: These are price points (green line/share) where a downward trend may be halted due to a concentration of buying interest. Imagine them as a safety net where buyers step in, preventing further decline.
Resistance Levels: Conversely, resistance levels (red line/shade) are where upward trends might stall due to increased selling interest. They act like a ceiling where sellers come in to push prices down.
Breakouts:
Bullish Breakout: When the price moves above resistance, it often indicates strong buying interest and the potential for a continued uptrend. Traders may view this as a signal to buy or hold.
Bearish Breakout: When the price falls below support, it can signal strong selling interest and the potential for a continued downtrend. Traders might see this as a cue to sell or avoid buying.
20 EMA (Exponential Moving Average):
Above 20 EMA: If the stock price is above the 20 EMA, it suggests a potential uptrend or bullish momentum.
Below 20 EMA: If the stock price is below the 20 EMA, it indicates a potential downtrend or bearish momentum.
Trendline: A trendline is a straight line drawn on a chart to represent the general direction of a data point set.
Uptrend Line: Drawn by connecting the lows in an upward trend. Indicates that the price is moving higher over time. Acts as a support level, where prices tend to bounce upward.
Downtrend Line: Drawn by connecting the highs in a downward trend. Indicates that the price is moving lower over time. It acts as a resistance level, where prices tend to drop.
RSI: RSI readings greater than the 70 level are overbought territory, and RSI readings lower than the 30 level are considered oversold territory.
Combining RSI with Support and Resistance:
Support Level: This is a price level where a stock tends to find buying interest, preventing it from falling further. If RSI is showing an oversold condition (below 30) and the price is near or at a strong support level, it could be a good buy signal.
Resistance Level: This is a price level where a stock tends to find selling interest, preventing it from rising further. If RSI is showing an overbought condition (above 70) and the price is near or at a strong resistance level, it could be a signal to sell or short the asset.
Disclaimer:
I am not a SEBI registered. The information provided here is for learning purposes only and should not be interpreted as financial advice. Consider the broader market context and consult with a qualified financial advisor before making investment decisions.

Symmetrical Triangle - Motilal OswalSymmetrical Triangle Observed with Below Improvements :
1. RS turning Positive
2. RSI > 50
Buy above 678
SL: 10 %
TGT: 850-870

MOTILALOFS - Ready for 15% up move?The stock was already in a up trend. It faced Price Rejection around 720 level and retreated. Took support at the previous support zone and gearing to move up. Money flow is positive. RS is also on the verge of turning positive. We can good delivery volumes indicating interest longer term buyers. Now likely to test the PRZ . Hence we could see a quick 10-15% up move.

Motilal Oswal Fina potential bullish move The stock is currently at a strong respected level of support. The bearish momentum is wearing off. There is also a strong demand zone at 505, so price could dip till there and bounce back up thus stoploss is well below the zone. Strong resistance and sell zone at 700 so placing the take profit there.
Disclaimer: I am not a SEBI registered analyst/consultant and not recommending anyone to take any BUY or SELL position in stock market. Investing in stock market is risky and one should do a self analysis and validation before investing in stock market. Consider this idea for educational purposes only.

MOTILAL OSWAL FINANCE LIMITEDUptrend with hh hls
Price taking support at 61.8% of last swing
Avwap breakout with good volumes n marabuzo candle
Entry only if stock open up last close

motilal oswal breakout(if sustained)increase in price of Motilal oswal share price due to stock split gave a breakout, if sustained can give a move upside

BullishThis information is for educational purposes only. It is not intended to be a substitute for professional advice. Always seek the advice of your Financial Expert or other qualified, with any questions you may have regarding this chart. Never disregard professional trader advice or delay in seeking it because of something you have read on this website.

Resistance broken after 6 years !Motilal Oswal Fin is a reputed company with steady and healthy financials. I have been tracking its move since last year (2023) and it has run up well. And now it has finally broken it's 6-year-long resistance at the 1600 level. If it takes support of this level and makes a higher top, then it might run up to 2000+ levels giving a decent but quick return of 20-25%.
