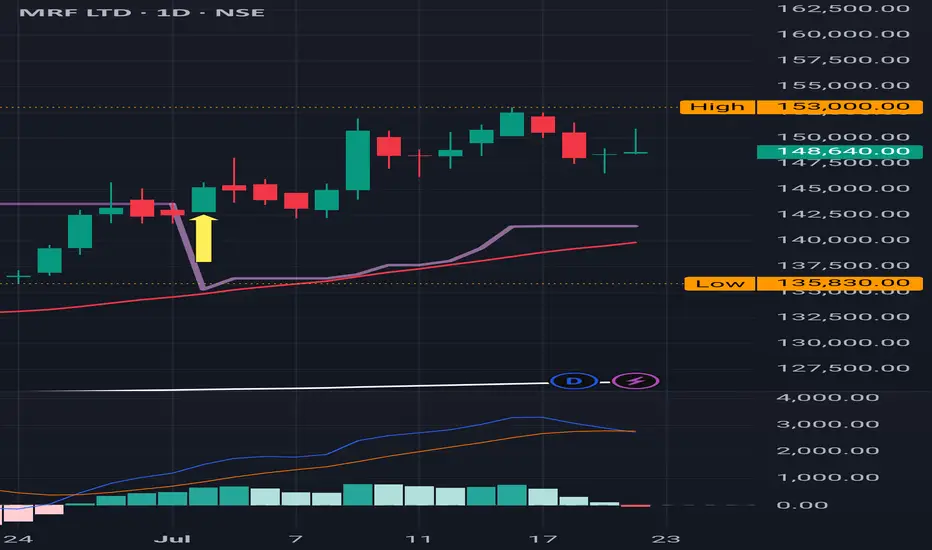
MRF : After a Buy Signal, made it to ATH MRF : After a Buy Signal, made it to ATH .
( Not a Buy / Sell Recommendation
Do your own due diligence ,Market is subject to risks, This is my own view and for learning only .)
MRF trade ideas
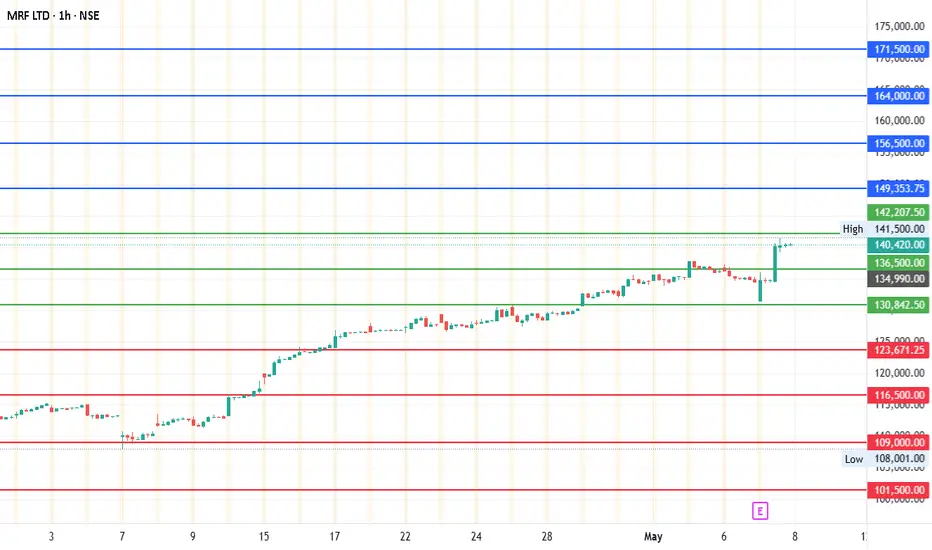
#MRF- Are we ready to see ₹30,000 Swing?#MRF has achieved the previous targets perfectly. Now are we going to witness any another rally of 30,000 points? Please be clear, I am not advocating for any particular direction, but it is going to be movement on any side.
Current Price: ₹ 140420
Mid-point: ₹ 1,36,500.00
Upside Lelvels: ₹ 1,49,353.75, ₹ 1,56,500.00, ₹ 1,64,000.00 and ₹ 1,71,500.00
Downside Levels: ₹ 1,23,671.25,₹ 1,16,500.00, ₹ 1,09,000.00 and ₹ 1,01,500.00
Stoploss: ₹ 1,30,842.50
Resistance: ₹ 1,42,207.50
MRF : Buy Triggered in this week MRF : Buy Triggered in this week
Developed a resistance at 148k
ATH is around 151k
( Not a Buy / Sell Recommendation
Do your own due diligence ,Market is subject to risks, This is my own view and for learning only .)

MRF BuyMRF jumped up taking support from its trend line. Buy @CMP (142400) with SL of 135800 and target of 150000 & 180000

MRFCurrent Price: 128655
Mid-Point: 129050.00
Upside: 131353.50 (Resistance), 135650.00 & 140600.00
Downside: 126763.00 (support), 122450.00 & 117500.00

MRF : Bulls are Back It's above 200 SMA MRF : Bulls are Back It's above 200 SMA
Back to back Greens from 105000 .
Resistance band is clearly visible on the chart
MACD is on a fly .
Not a Buy / Sell Recommendation
Do your own due diligence ,Market is subject to risks, This is my own view and for learning only .)

MRF Ltd. – High Potential Trade Setup & Market Analysis🚀 MRF Ltd. – Monthly Chart Analysis 📊
🔍 Key Observations:
📌 Current Price: ₹107,202.95 📉
The stock is down almost 67% from all time high
📌 Trade Setup:
🎯 Target Price: ₹151,110.25 (+60.72%)
⚠️ Stop Loss: ₹83,228.20 (-11.46%)
💡 Risk/Reward Ratio: 5.3 (Highly favorable setup!)
📌 Best Buying Range:
📍 Highlighted Zone: ₹91,230 - ₹94,060 (Perfect Accumulation Area)
🔥 Golden Opportunity for Smart Investors!
📌 Technical Structure:
📈 Uptrend Potential: If the price holds above ₹98,100, it could shoot up towards ₹151,110! 🚀
🛑 Strong Support Levels: ₹91,230 & ₹83,228 (Stop-Loss Zone)
📊 Key Resistance Levels: ₹107,200 & ₹151,110 (Breakout Zones)
📌 Market Sentiment:
📢 Stock is trading near a crucial buying zone!
🔥 A bullish breakout could lead to new all-time highs! 🚀
❗ If it falls below ₹91,230, expect a bearish reversal.
---
🎯 Conclusion & Strategy:
✅ For Long-Term Investors:
💰 Buying near the best buying range (~₹91,230 - ₹94,060) could be a smart wealth-building strategy!
✅ For Swing Traders:
📊 Entry confirmation is needed with strong volume & momentum indicators.
✅ For Risk Management:
⚠️ A strict stop-loss of ₹83,228 is a must to protect capital!
---
🚨 Disclaimer: I am NOT a SEBI-registered adviser. All levels & price targets are for educational purposes only. 📢 Stock market investments carry risks! Please do your own research or consult a SEBI-registered financial expert before making any investment decisions. ,👍up if you really like this idea.
📌 Trade Safe & Stay Profitable! 💹✨

MRF - Cup and Handle & Bullish Flag patterns (30% upside)MRF has sustained for almost a year in sideways mode. Given the Patterns of Cup and Handle along with Bullish Flag. Potential Target can be 178k from current level of 141k (30% upside)

MRF Stock Alert: Bullish Pennant Formation! 🚀 Are you ready for a breakout?📈
MRF stock is showing a promising bullish pennant pattern, signaling a potential upward price movement. This pattern often indicates that a strong rally might be just around the corner, making it an exciting opportunity for investors.
What is a Bullish Pennant?
A bullish pennant is a continuation pattern that occurs after a significant price rise, followed by a period of consolidation within converging trend lines. This is often seen as a pause before the next big move upwards.
Why is this important?
Strong Momentum: The prior uptrend sets a solid foundation.
Consolidation: MRF’s price has been stabilizing, indicating healthy market behavior.
Potential Breakout: Once the price breaks above the upper trendline, we could see new highs!
Key Levels to Watch:
Support Level: ₹131770.45
Resistance Level: ₹133350.25
🛑 Disclaimer: This is not financial advice. Always do your research and consult with a financial advisor before investing.
Are you keeping an eye on MRF? Share your thoughts below! 📊

DOUBLE CONFIRMATION OF REVERSALHere i shown confimation of reversal,i mentioned possible resistance level.

Swing | Descending triangle breakout | BULLhi traders,
There is a swing in daily timeframe.
At the same time frame there is a descending triangle pattern, here this triangle breakout is a trend reversal confirmation.
Overall the trend is BULL in both Weekly and Daily timeframe.
04% - 10% rally towards the target 1 and target 2.
FNO strategy : Go for the ATM CALL option & Protective PUT.
sbull.co
sbull.co

MRF LONGMRF - Set ups
MTF Analysis
MRF Yearly Demand Beakout 98600
MRF 6 Month Demand Breakout 101648
MRF Qtrly Demand 112727
MRF Monthly Demand 130387
MRF Weekly Demand 127100
MRF Daily Demand DMIP FRESH 126154
ENTRY -1 127100
SL 125580
RISK 1520
Taget as per Entry 159420
Points to Gain 16920
Latest Last Swing High 142500
Latest Last Swing Low 125580

MRF LONGMRF
MTF Analysis
MRFYearly Demand Breakout 98600
MRF 6 Month Demand Breakout 131000
MRFQtrly Demand Breakout 131000
MRFMonthly Demand DMIP 131000
MRFWeekly Demand 138500
MRFDaily Demand DMIP 139500
ENTRY -1 139500
SL 137697
RISK 1803
Potential Target 155294
First Target Points 149044
First recovery Target Points 11347
Last Swing Low 132600
Last Swing High 143947
RR 6
RR 11%

MRF Ltd. (NSE: MRF) – Technical Analysis UpdatePattern Formation: MRF Ltd. has been forming a cup-and-handle pattern over the past several months, indicating a bullish continuation. The stock has successfully tested the key Fibonacci retracement levels and is now moving towards potential breakout zones.
Cup-and-Handle Formation:
The rounded cup formed after the stock declined from its peak around ₹150,995 and found support near ₹115,601. The handle has now completed, as the stock consolidated within a falling wedge pattern, building strength for the next leg upwards.
Key Resistance Levels:
Immediate Resistance: ₹144,045 (4.26% upside) – This level aligns with the upper boundary of the wedge pattern. A breakout above this level would signal strength, confirming the end of the handle phase.
Major Target: ₹161,250 (16.54% upside) – This represents the projected target based on the full breakout of the cup-and-handle pattern, leading towards a possible rally to the previous all-time highs.
Support Levels:
Strong Support: ₹133,298 – This aligns with the 50% Fibonacci retracement level, where the stock has shown significant buying interest during previous dips.
Key Fibonacci Levels: 61.8% (₹133,475) and 38.2% (₹129,121) act as pivotal zones for any pullback in case of renewed selling pressure.
Volume Profile & RSI:
Volume Analysis: The recent volume spikes, especially during the approach to the wedge breakout, show accumulation, confirming investor confidence.
RSI: The Relative Strength Index is approaching the 60-70 range, suggesting a healthy bullish trend without overbought conditions.
Outlook: If MRF Ltd. breaks out of the ₹144,045 resistance level, it could see a swift move towards ₹161,250, a potential gain of 16.5% from current levels. Traders should look for strong volume confirmation during the breakout for additional momentum.
Risk Factors: If the stock fails to sustain above ₹133,298, there could be a deeper retracement to test lower Fibonacci levels, with downside risks towards ₹129,000-125,000.

MRF LONG 127000 RR 1: 10MRF
Current Price :
MRF Weekly Supply 147000
MRF Monthly Supply 136260
MTF Analysis
MRF YearlyDemand Breakout BUFL 98600
MRF 6 Month Demand BUFL 96000
MRF Qtrly Demand BUFL 11278
MRF Monthly Demand DMIP 130837
MRF Weekly BUFL 127100
ENTRY 129000
SL 124615
Target 173890
Last High 151445
RR 10.24

MRF LTD S/R Support and Resistance Levels:
Support Levels: These are price points (green line/share) where a downward trend may be halted due to a concentration of buying interest. Imagine them as a safety net where buyers step in, preventing further decline.
Resistance Levels: Conversely, resistance levels (red line/shade) are where upward trends might stall due to increased selling interest. They act like a ceiling where sellers come in to push prices down.
Breakouts:
Bullish Breakout: When the price moves above resistance, it often indicates strong buying interest and the potential for a continued uptrend. Traders may view this as a signal to buy or hold.
Bearish Breakout: When the price falls below support, it can signal strong selling interest and the potential for a continued downtrend. Traders might see this as a cue to sell or avoid buying.
20 EMA (Exponential Moving Average):
Above 20 EMA: If the stock price is above the 20 EMA, it suggests a potential uptrend or bullish momentum.
Below 20 EMA: If the stock price is below the 20 EMA, it indicates a potential downtrend or bearish momentum.
Trendline: A trendline is a straight line drawn on a chart to represent the general direction of a data point set.
Uptrend Line: Drawn by connecting the lows in an upward trend. Indicates that the price is moving higher over time. Acts as a support level, where prices tend to bounce upward.
Downtrend Line: Drawn by connecting the highs in a downward trend. Indicates that the price is moving lower over time. It acts as a resistance level, where prices tend to drop.
RSI: RSI readings greater than the 70 level are overbought territory, and RSI readings lower than the 30 level are considered oversold territory.
Combining RSI with Support and Resistance:
Support Level: This is a price level where a stock tends to find buying interest, preventing it from falling further. If RSI is showing an oversold condition (below 30) and the price is near or at a strong support level, it could be a good buy signal.
Resistance Level: This is a price level where a stock tends to find selling interest, preventing it from rising further. If RSI is showing an overbought condition (above 70) and the price is near or at a strong resistance level, it could be a signal to sell or short the asset.
Disclaimer:
I am not a SEBI registered. The information provided here is for learning purposes only and should not be interpreted as financial advice. Consider the broader market context and consult with a qualified financial advisor before making investment decisions.

MRF Breaking out looks good for short to mid termThis share looks ready to go higher. Risk reward sounds decent at this point. Any MRF fans out there?

MRF longMRF looks good to buy from here its my personal view do your own research if you want to trade. this is for education purpose only.
Thank you

MRF LONGMRF looks good to buy from here its my personal view do your own research if you want to trade. this is for education purpose only.
Thank you

MRFBO from 4hr trendline. Looks pretty good for long. DO your own analysis before taking any trade. Thank you. Do like and boost the idea if you find it helpful.

Amazing MRFThis stock mostly respect technical
Good consolidation and above important emas
Can look for short rallyeasy 5 - 7 % can be acheived

Descending Triangle Pattern Breakdown.Entry would be at current levels.
Stoploss & Targets marked on charts.

MRFthe script has the possibility of completing correction here and moving to the next wave 5 in the coming weeks as per the EW analysis and channeling technique. this point would be good to have a favorable risk reward ratio.
