MRPL, Bullish Momentum, Large Volumes, Long, 1DMRPL is showing very Bullish momentum with large volumes. If it breaks 160 with Bullish candlesticks then enter in the trade for the target of 170 and 180.
Entry: 160 (only on Bullish CandleStick)
Target1: 170
Target2: 180.
MRPL trade ideas

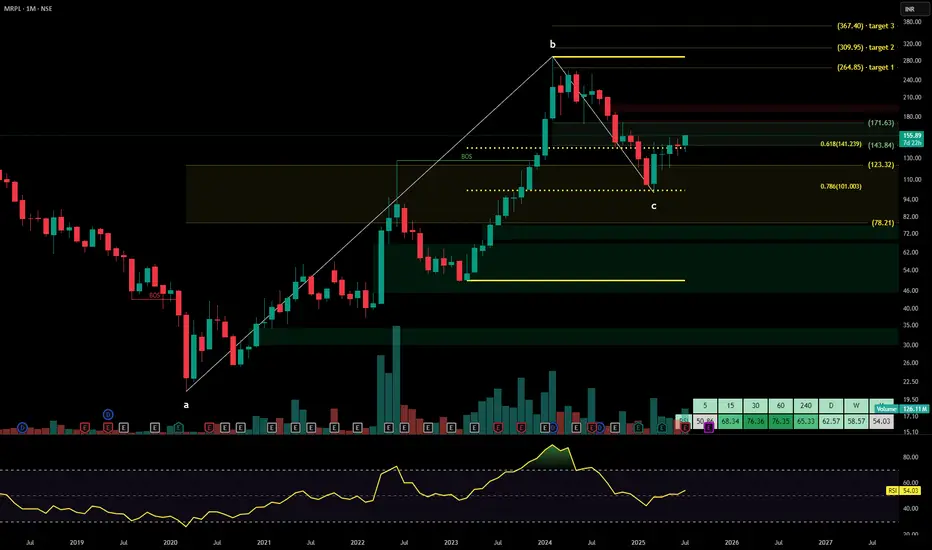
MRPLMangalore Refinery and Petrochemicals Ltd. is a subsidiary of ONGC and operates a state-of-the-art petroleum refinery in Karnataka, processing a wide range of crude grades to produce value-added petroleum products. It caters to domestic and export markets through refined fuels, petrochemicals, and specialty products. The stock is currently trading at ₹155.89.
Mangalore Refinery and Petrochemicals Ltd. – FY22–FY25 Snapshot
Sales – ₹83,556 Cr → ₹87,218 Cr → ₹89,744 Cr → ₹91,880 Cr – Topline remains stable with high crude volumes
Net Profit – ₹2,222 Cr → ₹2,068 Cr → ₹2,420 Cr → ₹2,655 Cr – Strong bottom-line driven by GRM and cost cuts
Company Order Book – Moderate → Strong → Strong → Strong – Sustained procurement cycle and export contracts
Dividend Yield (%) – 1.12% → 1.23% → 1.31% → 1.38% – Steady payouts supported by cash flow visibility
Operating Performance – Moderate → Strong → Strong → Strong – Higher capacity utilization and blended margins
Equity Capital – ₹1,752.68 Cr (constant) – No dilution
Total Debt – ₹10,222 Cr → ₹9,780 Cr → ₹9,340 Cr → ₹8,960 Cr – Deleveraging trend aligned to profitability
Total Liabilities – ₹18,400 Cr → ₹19,150 Cr → ₹19,850 Cr → ₹20,520 Cr – Stable liability expansion with crude cost
Fixed Assets – ₹5,980 Cr → ₹6,270 Cr → ₹6,560 Cr → ₹6,850 Cr – Gradual capex for emission norms and refining upgrades
Latest Highlights FY25 net profit grew 9.7% YoY to ₹2,655 Cr; revenue rose 2.4% to ₹91,880 Cr EPS: ₹15.15 | EBITDA Margin: 11.8% | Net Margin: 2.89% Return on Equity: 14.36% | Return on Assets: 9.63% Promoter holding: 88.58% | Dividend Yield: 1.38% Complex refinery product mix helped optimize GRMs during volatile crude cycles Strength in petrochemicals and export demand boosted margin stability
Institutional Interest & Ownership Trends Promoter holding remains dominant at 88.58% via ONGC, with no pledging or dilution. FII interest is muted given PSU profile, while domestic institutions maintain stable exposure. Volume data reflects rotational interest from value-oriented fund desks and government-linked mandates.
Business Growth Verdict Yes, MRPL is maintaining strong financial metrics despite macro volatility Margins supported by efficient refining and blended product strategy Debt trajectory is improving with strong operating cash flows Capex remains focused and strategically aligned to long-term energy goals
Company Guidance Management expects stable revenue and GRM levels in FY26, supported by improved plant utilization, export momentum, and diversification into petrochemical derivatives.
Final Investment Verdict Mangalore Refinery and Petrochemicals Ltd. offers a steady play in India’s refining and energy infrastructure vertical. As a PSU subsidiary with consistent cash flows, balanced profitability, and strategic expansion into petrochemicals, the company is positioned for long-term value delivery. Its operational discipline and blend of domestic and export markets make it suitable for accumulation by investors focused on energy-linked stability.
MANGALORE REFINERY & PETROCHEM 'S KEY LEVEL !! BREAKOUT !!This is the 4 hour chart of MRPL.
MRPL having a good law of polarity at 145 range.
MRPL is trading within a well-defined parallel channel, with support in the 135–140 range.
If this level is sustain , then we may see higher prices in MRPL .
THANK YOU !!

MRPLMRPL
Buy above 154 (Wait atleat to break the consolidation range)
Target: 160, 265, 270 above 270 price can be seen around 200
Time Frame: Within Few days

MRPL in 2nd BUYMRPL under vale is near140-80
margin of safety 50
now its in 2nd buy area so u can avrg the stock

A technical trade weekly TFAlmost 17 yrs consolidation breakout and retested the support....Sl below 137 closing basis....Target 254.....only for educational purposes and not any recommendation.....

MRPL - 45% down from its topOne of the follower has requested for the analyses of MRPL, hence publishing it, may be it would benefit remaining followers.
All details are given on chart. If you like the analyses please do share it with your friends, like and follow me for more such interesting charts.
Disc - Am not a SEBI registered analyst. Please do your own analyses before taking position. Details provided on chart is only for educational purposes and not a trading recommendation

Technical Analysis of MRPL Start Buying & HoldTechnical Analysis of MRPL (MRPL1h)
Key Observations from the Technical Point of View of the Chart:
Price Action: MRPL is currently trading slightly above its 200-day EMA (Exponential Moving Average), which is a bullish indicator. The price has been consolidating in a range over the past few days.
RSI (Relative Strength Index): The RSI is hovering near the neutral level of 50. This suggests that there is no strong bullish or bearish momentum at the moment.
Volume: The volume appears to be relatively low, which could indicate a lack of interest or indecision among traders.
Potential Scenarios:
Breakout Above 200-Day EMA: If MRPL can break above the 200-day EMA with increasing volume, it could signal a bullish uptrend. Traders might look for a higher target, potentially around the previous highs.
Pullback to Support: If the price retraces, the 200-day EMA could act as a support level. A pullback could provide a buying opportunity for those who missed the previous uptrend.
Range-Bound Trading: If the volume remains low and the price continues to consolidate within the current range, it could indicate a period of indecision. Traders might wait for a clear breakout or breakdown before taking a position.
Key Levels to Watch:
Support: 200-day EMA (around 213.15)
Resistance: The previous highs (around 224.36)
Trading Strategies:
Bullish Strategy: Buy if MRPL breaks above the 200-day EMA with increasing volume. Place a stop-loss below the recent low.
Bearish Strategy: If the price breaks below the 200-day EMA with decreasing volume, consider selling. Place a stop-loss above the recent high.
Remember: Technical analysis is just one tool in the investment toolkit. It's crucial to consider other factors, such as fundamental analysis, market news, and risk management, before making any investment decisions.
Disclaimer: This analysis is based on the provided chart and technical indicators. It's essential to conduct thorough research and consider other factors before making any investment decisions. Do your own research before buying this stock because we are not responsible of your loss. I am not SEBI registered person to suggest any stock and this is my personal opinion about the stock only for practice and education purposes.
Thanks for your support as always

MRPL SYMMETRICAL TRIANGLE MRPL is formed Symmetrical Triangle Pattern and it is ready to start upmove. This is the best place to catch this trade the reason is that your SL will be very less of you catch the stock at support level.
SL: Symmetrical Triangle bottom line break down.
Disclaimer: Only for educational purpose.

MRPL - swing trade CMP - 242
Tgt - 257, 285
Sl - 225
This is not a recommendation on buy/sell. Please consult your financial advisor before any investment.

MRPL Breakout happend in this stock with rising 200dma.
Keep your risk and reward ratios according to your own preferance.
This is for educational purpose, do your own research before investing.

MRPL triangle breakoutShowing strength after consolidating for 95 trading sessions (almost 5 months), can move till 400.

MRPL DAILY CANDLE...25.06.2024MRPL forming inverse Head & Shoulder pattern ,so once its breaks will expect 260-280 in short term.(DYOR)

MRPL TARGETSMRPL, after reaching a low, is now back on track. Following the reduction in windfall tax, it is poised to reach its previous levels. The stock is currently in an uptrend and is expected to surpass its previous high this week. Targets and support levels are indicated in the chart.


MRPLLooks Good on Chart.
Volume Buildup followed by Consolidation.
Good for Short term.
Target 290 ,360 ...
Do Like ,Comment , Follow for regular Updates...
Keep Learning ,Keep Earning...
Disclaimer : This is not a Buy or Sell recommendation. I am not SEBI Registered. Please consult your financial advisor before making any investments . This is for Educational purpose only.

MRPLCMP 254
Sl 244
Targets 20% +
Looks good for a swing ...good volumes seen ...tight action in last few days ..can a give a momentum burst .

Volume Breakout - Crossover Trade - MRPL📊 Script: MRPL
📊 Sector: Refineries
📊 Industry: Refineries
Key highlights: 💡⚡
📈 Script is trading at upper band of BB and giving breakout of it.
📈 MACD is giving crossover.
📈 Double Moving Averages are giving crossover.
📈 Stock is moving along with volume which indicates Volume Breakout.
📈 Script may give some profit booking initially because today stock was up by almost 11%.
📈 Right now RSI is around 65.
📈 One can go for Swing Trade.
⏱️ C.M.P 📑💰- 248
🟢 Target 🎯🏆 - 280
⚠️ Stoploss ☠️🚫 - 236
⚠️ Important: Always maintain your Risk & Reward Ratio.
✅Like and follow to never miss a new idea!✅
Disclaimer: I am not SEBI Registered Advisor. My posts are purely for training and educational purposes.
Eat🍜 Sleep😴 TradingView📈 Repeat 🔁

Expected Upward momentum of 20% in MRPLMRPL has seen a good breakout on daily TF after almost a consolidation of 2 weeks with good volume on daily TF.
The company has increased institutional investing and a healthy QoQ growth for the last 2 quarters to add to strength.
Good for swing traders. Can hold for about 10 days.
Entry - INR 238.5 (Trade Initiated)
SL - (DL) - INR 230
TSL - According to your risk profile.
Disclaimer: Please be advised that the information provided is not intended as financial advice. It is imperative to conduct thorough research before making any investment or trading decisions.

Manglore Refinery & Pet (MRPL) - Buy on Breakout or Wait for DipMangalore Refinery and Petrochemicals Limited, is a division of Oil and Natural Gas Corporation which is under the ownership of the Ministry of Petroleum and Natural Gas of the Government of India. Established in 1988, the refinery is located at Katipalla, north from the centre of Mangalore.
Revenue: 86,161 crores INR (US$11 billion, 2022)
Total assets: 40,071 crores INR (US$5.0 billion, 2022)
Net income: 2,950 crores INR (US$370 million, 2022)
Buy this stock above 220
As per previous chart history and technical analysis alongwith Fundamental inputs of the stock, it indicates that you can buy or hold your stock for minimum 30-50% profit in short term as per chart analysis.
All major points are mentioned on the chart itself
Do your own research because I am not SEBI registered person and this is my personal opinion about this stock
Thanks for your support as always


Mangalore Refinery And Petrochemicals LtdTarget Mentioned in chart with strict stoploss at 110
FUNDAMENTALS
Market Cap
₹ 23,511 Cr.
Current Price
₹ 134
High / Low
₹ 136 / 49.2
Stock P/E
6.21
Book Value
₹ 67.9
Dividend Yield
0.00 %
ROCE
20.1 %
ROE
31.1 %
Face Value
₹ 10.0
Promoter holding
88.6 %
EPS last year
₹ 15.0
EPS latest quarter
₹ 6.04
Debt
₹ 14,207 Cr.
Pledged percentage
0.00 %
Net CF
₹ 1.28 Cr.
Price to Cash Flow
3.69
Free Cash Flow
₹ 5,662 Cr.
Debt to equity
1.19
OPM last year
6.00 %
OPM 5Year
3.50 %
Reserves
₹ 10,154 Cr.
Price to book value
1.97
Int Coverage
5.67
PEG Ratio
1.92
Price to Sales
0.25
Sales growth 3Years
28.8 %
Return on assets
7.04 %

Swing Trading idea- MRPL
Sure, let's break it down in simpler terms:
"MRPL, which stands for Mangalore Refinery and Petrochemicals Limited, has been forming a rounding button pattern over the past 1.5 years. This pattern suggests that the stock has been consolidating, meaning it has been trading within a certain range.
Now, based on this pattern, it seems like a good time to consider buying the stock, especially if its price goes above 130. The target prices to consider are 145, 164, 200, and 254.
Stoplossbelow 98. One can buy accumulation basis as it can retest till 98
In simpler words, MRPL has been in a stable phase, and if it crosses the 130 mark, it might be a good idea to buy. The potential future prices to aim for are 145, 164, 200, and 254."
Please note that investing in the stock market involves risks, and it's essential to do thorough research or consult with a financial advisor before making any investment decisions.
