MMFIN short opportunity, below horizontal levelGo with a bear spread to stay safe from choppiness, no naked puts.
M_MFIN trade ideas

Buy Long- Mahindra & mahindra Finance at 164 for target of 196 NSE:M_MFIN Cup and Handle formation Breakout with high volume expected returns- 18.95%

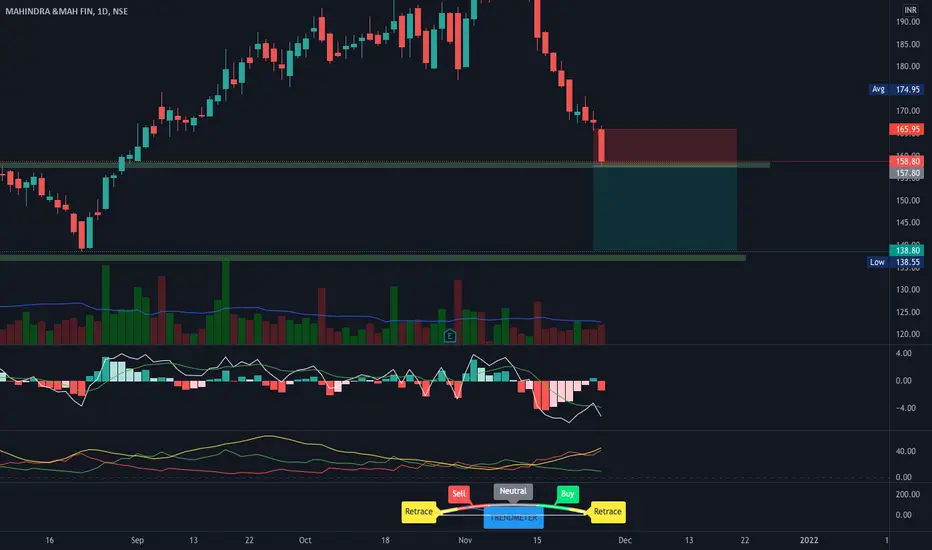
M_MFIN ( intraday levels ) Mahindra & Mahindra Finance, this stock is showing weakness on daily and weekly chart, if it breaks down the level of 138.50, then possibly more bearishness could be seen on chart, one can go short if this level is broken or if any Shorting opportunity is seen on 5 minutes time frame, with Stoploss of 138.50 & above, for targets of 133.50 or upto 128.55. Sell only Below 138.50 in intraday and Buy only above 146.50 in intraday.
Support area
Macd in daily is negative
Macd in weekly is also Negative
Rsi in daily below 40 and down tick
Disclaimer
I am not sebi registered analyst
My studies are Educational purpose only
Please consult your Financial advisor before trading or investing

MAHINDRA FINANCE - BULLISH SWING TRADE
Looks bullish on weekly charts, ready for break out above Red Trendline.
Trade Idea -
Go long if price closes above RED TRENDLINE on WEEKLY CLOSING BASIS
STOP LOSS - Below Red trendline ON WEEKLY CLOSING BASIS
Thanks for watching
All the Best

Mahindra & Mahindra Finance Swing Trade Setup The stock is heading for its strongest demand zone. A good buying opportunity, start to invest in parts. All levels have been marked on the charts.

Trend line analysisPotential buy in m&m finance. I can go up to 268
(92%) returns on your investment.

Long oppertunity 1. Bounce back from support zone
2. Bounce back from trendline support
3. Short term trendline breakout

Mahindra finance for long term 1. 3 supports at the bottom
2. 3 resistance at the top
3. Perfect triangle pattern is forming, which has being consolidating for nearly 2 years
4. Good time to enter by considering today's closing
5. Keeps good track records as of now
6. Can expect positive trend for the month of November
2021

M&m finanaceEntered today based on range n consolidation breakout will watch this series tgt 210/220 so days low

Breaking......bear...................................................bearish....................................
M_MFIN breakout retested and going longM_MFIN breakout retested and going long
I'm not a SEBI registered analyst, so do your own research.

Swing PicClear Flag in Daily Chart
Good Candle Pattern
after breakout it's retested......so we expect good upside


Long on M&M finance,CMP 188.20, Multibaggerr 2X stock as per chrLong on M&M finance,CMP 188.20, Multibaggerr 2X stock as per chr
Targets are (sure 270),288,326.


Sell M&M Finance, CMP 179.05Sell M&M Finance, Diverging triangle formed with Lower Highs and Lower Lows. Market is Bearish, will follow market sentiments and move downwards.
TP ~173-174

M&M finance crossing 200 EMA and Good in VolumeM&M Fin: CMP: 180its crossing the 200 EMA and also in good in volume.
Disclamer:Please check with your financial adviser before taking any trade and also put your own analysis.

M&M Financial Short Term BreakoutThe stock has broken out and took support at the previously upper trendline. Trade is supported by brokerage calls, and Supports Nearby.
The stock has previously broken out with good volumes and retested the upper trendline, the point of entry.
Risk Reward Ratio - 1:1.
SL is placed below multiple major support zones, and previously upper & lower Trendlines. Target is placed near the swing high based on fundamentals.

m&m fin- multiple indicators flipped long todayUnderperformer well priced stock. turning to long after 9th april

M_Mfin LongM_Mfin Long
Buy on close above 156
Buy above- 156
SL- 148.5
Target- 164, 175
Disclaimer- We are not SEBI registered advisor.
Charts and views are only for educational purpose.

Buying setup in M&MFIN for positional setup
(Note:- This is my personal views. Please consult with your financial advisor before taking trade.
