National Aluminum - Elliott Wave CountNational Aluminum - Elliott Wave Count
markets seem to have completed the correction and soon will start a new upward impulse wave with a target of 100 and above. However, if the market drops below 85, this view is invalid.
Please note that this information is solely for educational purposes, and it is essential to exercise caution when trading.
NSE:NATIONALUM NSE:NATIONALUM1! BSE:NATIONALUM BSE:NALC1!
NATIONALUM trade ideas

28% UPSIDE POTENTIAL IN NATIONALUMBreakout of crucial resistance in NATIONAL ALUMINIUM.
Wait for retest at the marked level to take it to the upside.
Target - 125

Nalco LongNALCO was in consolidation for 1 year and has given weekly breakout
buy 81.5
SL 79
target 97

NATIONALUM: Ascending Traingle Metal Index is expected to do better as the Dollar index is below 100.
NATIONAL ALUMINUM has given a breakout after good consolidation. can be entered till 87. SL at 83.5. can go upto 95/99

Resistance Breakout - NALCOPlease look into the chart for a detailed understanding.
Consider these for short-term & swing trades with 2% profit.
For BTST trades consider booking
target for 1% - 2%
For long-term trades look out for resistance drawn above closing.
Please consider these ideas for educational purpose
Please note that, if there are some big targets, those are drawn thinking for long term.

NALCO Bullish setup can go up to 115nalco having good breakout with long consolidation...best buy at market price sell at 115.
but a low risk slow moving stock

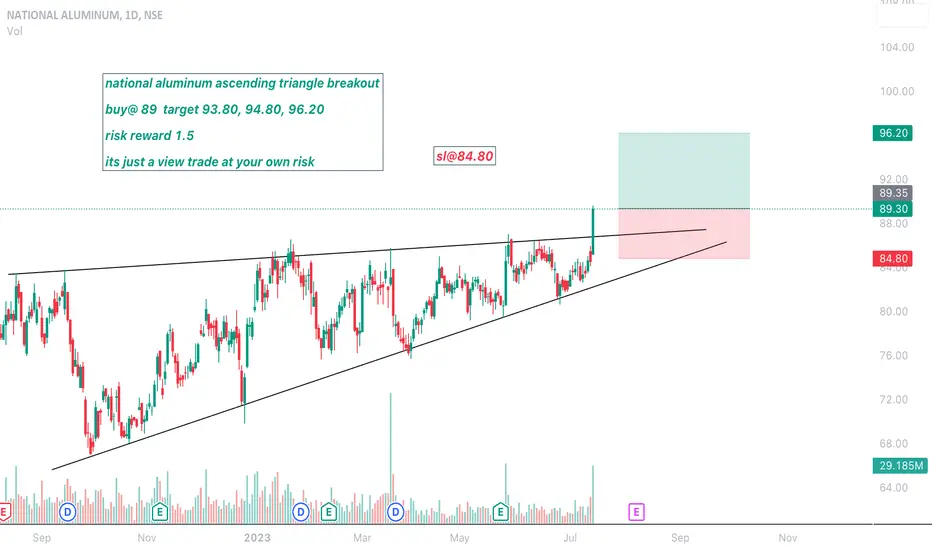
national aluminum ascending triangle breakout buy@ 89 target national aluminum ascending triangle breakout
buy@ 89 target 93.80, 94.80, 96.20
risk reward 1.5
its just a view trade at your own risk
sl@84.80

National Aluminium LtdSmall cap stock National Aluminiumm is moving Up side.
at good Levels, BO in weekly TF, also good in daily TF, its just my view
sharing with you. No Buying recommendations.
Thank you

NATIONAL ALUMINUMDISCLAIMER
it's just my technical view. I'M NOT A SEBI REGISTERED ANALYST. Before taking trade or Invest consult your financial advisor.
✅Here we provide TECHNICAL Levels and Charts.💯
✅This channel is for educational and self analysis purposes only!

National AluminiumNational Aluminium has given a breakout in the daily and weekly time frame with good volumes after its fell on June 2022. Short term target will be 92.8 its previous high. SL - 84.45.
Not an investment advice. Do your own analysis.

#Nalco - Reversal and uptrend#NALCO - Looking strong and just broke the yearly resistance of 86.75. Short Term (weekly)- consolidation might occur in 89 - 92 zone, break of 92 will lead to a strong momentum in medium term.
Resistances - 92.10 - 95 - 101.2 (Strong)- 108.65 - 122.85 - 133
Support - 86.75 (Strong) - 79.40 - 76.30- 67.30

NALCO - SWING TRADE FOR NEXT WEEKAfter a very long consolidation in a form of Ascending Triangle a good breakout is there with a good volume .

Breakout happend.Breakout happend in this stock.
Keep your risk and reward ratio according to your preferance.
This is for educational purpose. Do your own research before investing.


NATIONALM ANALYSIS - ASCENDING TRIANGLE PATTERN BREAKOUT NATIONALM
Everything is clearly mentioned on the chart it self.
ASCENDING TRIANGLE PATTERN BREAKOUT ON WEEKLY CHART.
As I am writing this the market is highly bullish and global market sentiment is also highly bullish.
Thank you.

NALCO...BuyGood breakout ,,INTO a new price zone...buy both investors and traders..for traders stoploss is given

National Aluminum (Flag & Pole)National Aluminum (stock symbol: NATIONALUM) experienced a significant decline from its peak at 127, dropping down to 67. However, it found support at this level and formed a double bottom pattern, with the second low also at 67. Subsequently, the stock began a slight upward movement but has remained within a channel pattern since August 2022 until today, 29th June 2023. Notably, the trading volume has gradually decreased during this channel period.
A breakout on either side of the channel is expected to result in a substantial move, with a preference for the downside. For a short position, it is advisable to enter at 79.10, and the first target for this downward movement is set at 71.35. If the decline continues, the second target is projected at 67.25.
Conversely, for a long position, the entry price is 86.75, and the first target for an upward move is set at 99.70. It's important to note that National Aluminum is an FnO (Futures and Options) stock, allowing for trading in both equity and FnO segments.
Please note that this analysis is based on the provided information, and it's always recommended to conduct further research and analysis or consult a financial advisor before making any investment decisions.

National Aluminium By
Tristartrading substack
Weekly ascending triangle, the stock is ready to breakout and continue moving higher towards Rs.96

Possible breakout for NATIONAL ALUMINIUMOnce the resistance of 85.35 gets breached on a closing basis, 1st target is up to 95, then 105 opens up.

National Aluminium short term ideaNationalum is broke it's resistance we can expect good momentum from here. Please wait for entry. And please watch price action

NATIONALUM - Weekly AnalysisIn the Weekly Chart of NATIONALUM ,
we can see that, after multiple failure of Cup & Handle,
It has now at decision making.
possible momentum are shown in charts.

NATIONALUM 4HRSNSE:NATIONALUM
hello trader this the chart of nationalum of 4hrs timeframe. its going through downtrend in bigger time frame. still it have a trendline support.downside support level 67. if breakout happened towards upside then we have to see fibonacci level.upside resistance level 86.
