NESTLEIND trade ideas

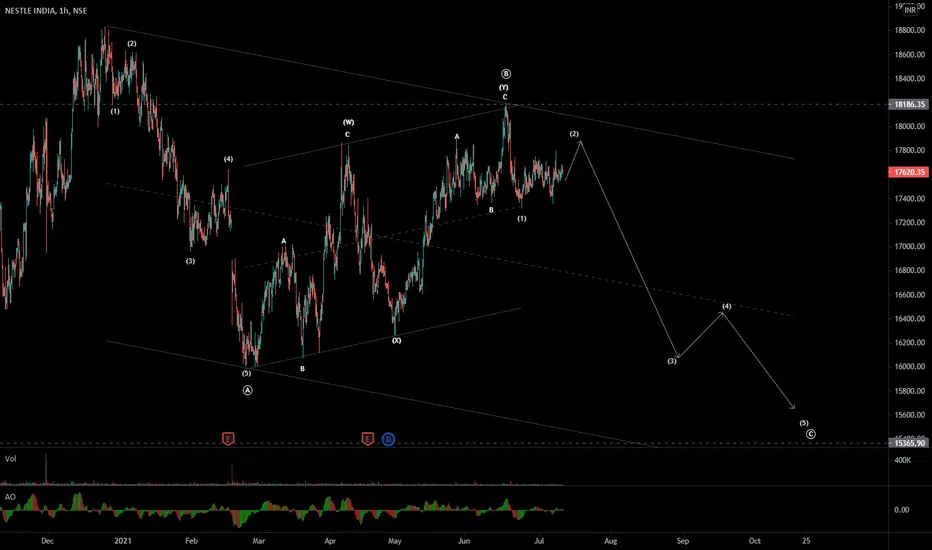
NestleInd - Elliott wave Analysis - C of ABC zigzag It is in2nd wave correction of C wave as in ABC zigzag bearish pattern.
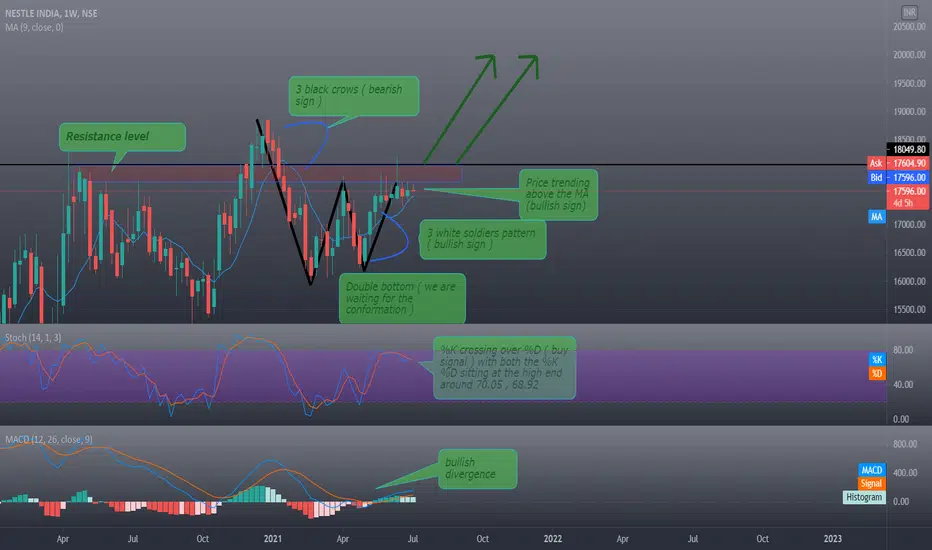
Nestle IND Stock Analysis 1W 05/07/21Hello everyone , as we all know the market action discounts everything :) looks like a double bottom has formed and the stock could be rallying up as soon as we get the conformation around the 18050 area , if that happens the stock could be going up to the ranges of 20000 . MA giving us a bullish sign and both the Stoch and MACD giving buy signals with noticeable bullish candlestick pattern (3 white soldiers )
Fundamental analysis :
Nestle India Ltd. quote is equal to 17602.80 INR at 2021-07-05. a long-term increase is expected, the "NESTLEIND" stock price prognosis for 2026-06-29 is 33720.90 INR. With a 5-year investment, the revenue is expected to be around +91.57%.
Make sure to Follow and Like for more content
If you have any questions please ask
Thank you for reading.
NESTLEINDIA BEARISH SIGNALHello Trader NESTLEINDIA formed a Head and Shoulder pattern in Daily Time frame and it also fails to cross its area of Resistance please do your own analysis if you fell my analysis is helpful for you please like and follow me. Thank You


bullish in one day- possible to continue uptrendtraditionally bullish stock
bounces as soon as comes near 200 dma
has been in uptrend in recent days
good option to buy as its again close to 200 dma


Channel and broken trend line Stock Analysis: Nestle india has formed channel and taken support from bottom of channel and broken trend line as long as not breaking below channel expected target marked on the chart.
let's see..


Nestle India forming Header and Shoulder PatternNestle India is forming a header and shoulder pattern in 4hour chart.
It seems bearish now.
It is in crucial support zone.
If that breaks, there is a free fall upto 16,200 and 16,100.
Only for educational purpose!


Nestle formed Bullish Flag pattern, signaling Buying OpportunityIt may make sense to explore Call Options:
Feb Expiry - 17500 CE
March Expiry - Revisit in the week of 21st depending on where the CMP is and which is a decent strike to buy after Nestle declares results for Q3 on 16th February
*For Education purposes only - please do not trade without proper analysis


FALLING FLAG IN NESTLE INDIANESTLE INDIA IS FORMING THE FALLING FLAG PATTERN AND NOW ITS IN THE CRUCIAL SUPPORT.
WE CAN GO LONG, WHEN IT BROKE THE 17300 IN 1HOUR TF AND GO SHORT BELOW 16960
TARGETS ARE SPECIFIED IN CHART AND SL IS BASED ON WHAT TYPE OF TRADER YOU ARE !!
SUITABLE FOR INTRADAY AND AS WELL AS SWING TRADES
BEFORE ENTERING THE TRADE, DO YOUR OWN ANALYSIS IN IT


NESTLEINDIA - LongNestle India 15min TF
17500 levels are tested multiple times, if this resistance breaks then a good intraday move on the upside can be seen.
Keep an eye on this......

Buying OpportunityHello traders, have a look at the NESTLEIND, it has been retraced 50% from the top (green line) according to Fibonacci tool and creating a bullish cross over in MACD and just wait to cross & close above the 20 DEMA, so many things are showing positive move. so keep eyes over that..have a safe trading & good luck !
