NHPC trade ideas
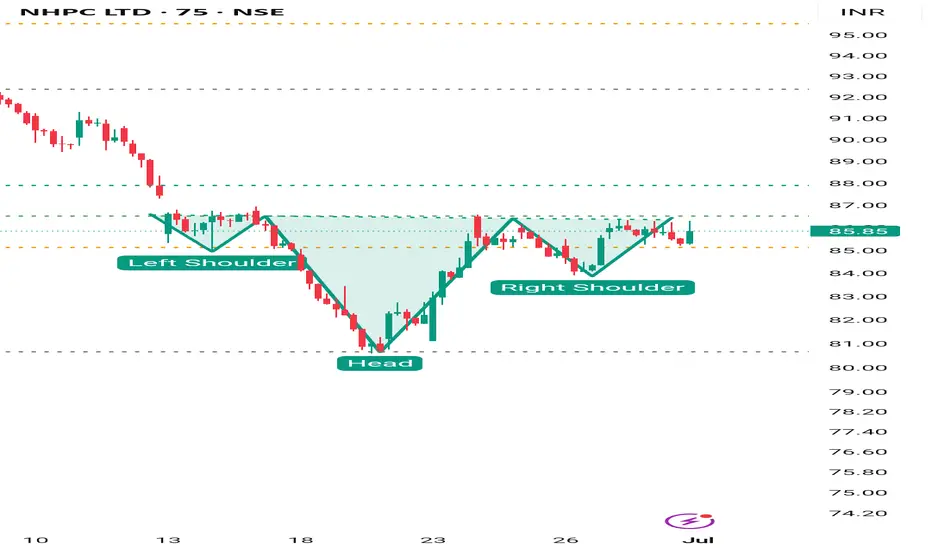
NHPC INVERSE HEAD AND SHOULDER BREAKOUTInverse Head and shoulder at NHPC ABOVE Neckline
Now target is 110

NHPC - SECOND ENTRY INITIATEDEverything is pretty much explained in the picture itself.
I am Abhishek Srivastava | SEBI-Certified Research and Equity Derivative Analyst from Delhi with 4+ years of experience.
I focus on simplifying equity markets through technical analysis. On Trading View, I share easy-to-understand insights to help traders and investors make better decisions.
Kindly check my older shared stock results on my profile to make a firm decision to invest in this.
For any query kindly dm.
Thank you and invest wisely.

Technical Analysis of NHPC LtdTechnical Analysis of NHPC Ltd
Let's analyze the NHPC Ltd chart you provided to assess its potential for reaching a 52-week high or low.
Key Observations:
Downward Trend: The chart exhibits a clear downward trend, indicated by the consistent lower highs and lower lows. This suggests a bearish market sentiment for NHPC Ltd.
Support and Resistance Levels: Several horizontal lines are drawn on the chart, likely representing support and resistance levels. The price has been bouncing off these levels, indicating their significance in influencing price action.
Fibonacci Retracement: A Fibonacci retracement tool is applied, highlighting potential support or resistance levels at 0.236, 0.382, 0.5, 0.618, and 0.786 retracement levels. The price has interacted with these levels, suggesting their potential influence on future price movements.
RSI (Relative Strength Index): The RSI indicator is below 50, indicating bearish momentum. A reading below 30 would suggest oversold conditions, which could potentially lead to a price reversal.
Analysis and Outlook:
Given the current downward trend and the bearish RSI reading, it seems unlikely that NHPC Ltd will reach a 52-week high in the near future. However, the price could potentially find support at the 0.236 or 0.382 Fibonacci retracement levels or the horizontal support lines.
Potential Scenarios:
Continued Downward Trend: If the bearish momentum persists, the price could continue to decline, potentially breaking below the current support levels.
Consolidation and Reversal: If the price finds support at one of the levels mentioned above and the RSI starts to rise, it could indicate a potential reversal or consolidation phase.
Important Considerations:
Fundamental Analysis: Technical analysis should be complemented with fundamental analysis to gain a comprehensive understanding of a stock's prospects.
Market Conditions: Overall market conditions can also influence individual stock prices.
Risk Management: It's crucial to implement proper risk management strategies, such as setting stop-loss orders, to limit potential losses.
Remember: Technical analysis is just one tool in an investor's toolkit. It's always advisable to combine it with fundamental analysis and consider other factors before making investment decisions.
Disclaimer: This is not financial advice. Please consult with a financial advisor before making any investment decisions. We are not responsible for your loss because we are not SEBI registered and this analysis based on technical aspects and only for educational practice. Do your own research.

NHPC swing trade, visit chart for details analysisHello,
Trend-Based Analysis. Buy the Dips, Sell The Rallies, Also Following the Trend. Let's see where the Price Action takes us, Riding the wave. Potential trade setups based on trend momentum.
Technical analysis based on trend identification and momentum, Looking for high-probability setups within the prevailing trend.
Analyzing the current market trend and potential future price movement. Focusing on risk management and reward-to-risk ratios.
Details is Mentioned in Chart, Read carefully.. .

In nhpc show strong show support 75 and 70nhpc show strong support and resistance show if break u can target 150 +

NHPCRecently we have seen heavy sell-off in NHPC, almost crashed -36%, Took support on bottom level, ready for 85 in few days.


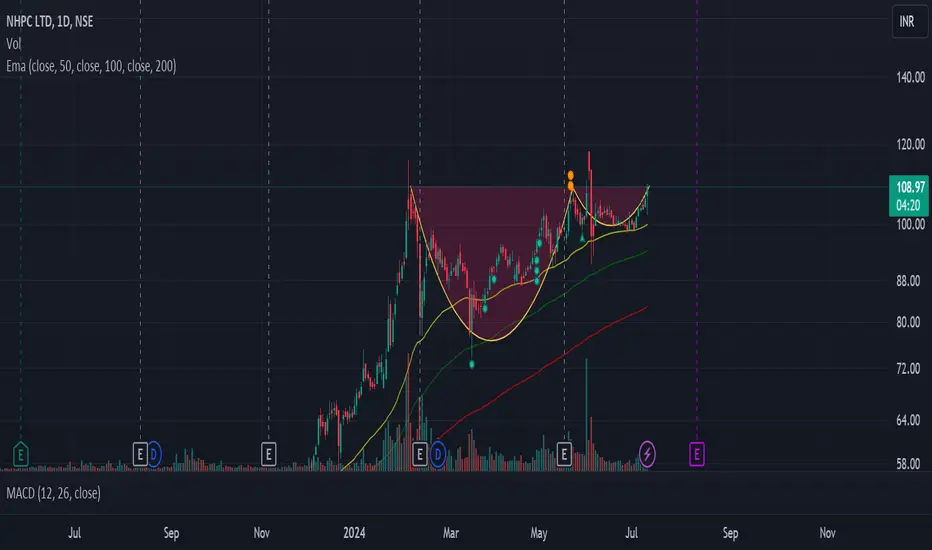
Take a look at NHPC NHPC has forming classical cup and handle pattern
Union budget is around the corner
Solar energy sector likely to get boost
Target could be 116, 126, 140
SL 100
This is only for educational purpose
Technical Analysis of NHPC Ltd (Bullish Momentum)Technical Analysis of NHPC Ltd (NSE:NHPC)
Overview of the Stock:- The chart shows a 1-hour timeframe for NHPC Ltd (NHPC) on the National Stock Exchange (NSE) of India. The key indicators used include:
Price Action: The price movement of NHPC's shares.
Fibonacci Retracement: Levels indicating potential support or resistance based on Fibonacci ratios.
EMA (200): A 200-period Exponential Moving Average, often used to identify trends.
RSI (Relative Strength Index): A momentum indicator that measures the speed and change of price movements.
My Technical Analysis based on Price Action - NHPC has been in a sideways trend or consolidation phase. The price is currently trading near the 0.382 Fibonacci retracement level, which could act as support.
Fibonacci Retracements:- The 0.618 and 0.786 Fibonacci retracement levels are above the current price, suggesting potential resistance areas. A break above these levels could indicate a bullish trend reversal.
EMA (200):- The price is currently below the 200-period EMA, indicating a bearish trend.
A break above the EMA could signal a potential bullish trend reversal.
RSI: - The RSI is currently hovering near the neutral level of 50. This suggests that the market sentiment is neither strongly bullish nor bearish.
Potential Outlook - Based on the analysis, the following scenarios are possible:
Sideways Consolidation: If the price remains within the current range, it suggests a sideways trend or consolidation phase.
Bullish Reversal: A break above the 0.618 and 0.786 Fibonacci retracement levels, coupled with a break above the 200-period EMA, could signal a bullish trend reversal.
Bearish Continuation: If the price continues to fall below the 0.382 Fibonacci retracement level, it could indicate a continuation of the bearish trend.
Note: The above analysis is based on technical indicators and does not consider fundamental factors that could impact NHPC's stock price. It is essential to conduct a comprehensive analysis, including fundamental factors, before making investment decisions.
Disclaimer: This analysis is based on the technical analysis based on price action theory and with the help of technical indicators and is for informational/education purposes only. It does not constitute financial advice. Always consult with a financial advisor before making investment decisions. Do your own research before buying this stock because I am not SEBI registered person to suggest any stock
Thanks for your support as always

#NHPC for swing As we can see the stock is ready to change its direction as bull
After changing its direction you can take a trade
For 10 % profit

Cup and Handle Pattern in NHPC on Daily ChartCup and Handle Pattern in NHPC on Daily Chart
Entry above 118.50
SL @ 111.50
Tgt1 @ 125
Tgt 2 @ 130
Tgt 3 @ 135

a Look at NHPCStock is taking support at trendline
Its might for cup and handle pattern
buy now for target of 110 then could be 30 more target
or buy above 110 for 25% gain
This is strictly for eductional purpose
Market is ATH (trade accordingly)
Keep watch on market condition, if market falls no strategy works

NHPC Ltd
Bullish view - Requires breakout or cross above 88
Bearish or weaker if it breaks 78
Fundamentals
Market Cap
₹ 85,433 Cr.
Current Price
₹ 85.0
High / Low
₹ 116 / 38.7
Stock P/E
23.0
Book Value
₹ 38.9
Dividend Yield
2.18 %
ROCE
8.49 %
ROE
10.8 %
Face Value
₹ 10.0
Price to book value
2.19
Intrinsic Value
₹ 50.9
PEG Ratio
2.43
Price to Sales
8.74
Debt
₹ 30,110 Cr.
Debt to equity
0.77
Int Coverage
12.4
Reserves
₹ 29,020 Cr.
Promoter holding
71.0 %
Pledged percentage
0.00 %
EPS last year
₹ 3.87
Net CF
₹ -295 Cr.
Price to Cash Flow
18.2
Free Cash Flow
₹ -268 Cr.
OPM last year
58.5 %
Return on assets
5.19 %
Industry PE
22.5
Sales growth
-6.11 %

NHPC # SWING NHPC making higher high as bull move and it ready to make one more high as keeping small stope lost you can enter
NHPC Trade IdeaCan't get enough of the Trendline support ?
Just Kidding
Has been consistently taking support from this Trendline and moving.
Entry can be above the horizontal TL break.

NHPC LTD - STOCK BREAKOUT FOR SWING TRADING#NHPC
STOCK ENTRY FOR SWING TRADING
Entry - 100
SL - 86
Targets - 115, 135
@Jagadheesh_JP

#NHPC Company has been maintaining a healthy dividend payout of 49.5%
The company is actively engaged in the construction of 15 Solar and Hydro Power Projects of 10449 MW Capacity (including JV & Subsidiaries). Total projects under clearance stood at 4112 MW and projects under survey stood at 4110 MW as on Dec’23.
MOUs
Company has signed a MoU on 3 Jan 2024 with GPCL for proposed investment of Rs.4000 Cr in Kuppa Pumped Storage Project (750 MW), Chhota Udaipur, Gujarat.
Company signed an MOU with Govt. of Odisha through GRIDCO Limited on 23 Jun 2023 for Development of Pumped Storage Projects and Renewable Energy in the State of Odisha.
It signed an MOU on 23 Aug 2023 with APGENCO for Implementation of Pumped Hydro Storage Projects and Renewable Energy Projects under Joint Venture Mode in Andhra Pradesh. The MOU envisages Implementation of two Identified Pumped Hydro Storage Projects namely Kamlapadu- 950 MW and Yaganti 1000 MW PSPs in the first phase.
Focus
Being a hydro power company shifting its focus toward the renewable energy segment as well. Out of 10499 MW capacity under construction 1135 MW is for Solar power. It has recently signed a contract to develop additional 2000 MW solar power capacity in Rajasthan. About 9090 MW Solar power capacity is under Tender and pipeline including as a Intermediary Procurer.

NHPC LTDUptrend HH HL
Pullback halted at 50% fibonnaci volumes
dries up volmes in pullback
Price moved up with good bullish candle n good volumes.
Rsi broken last high


Triangle pattern on NHPCNHPC formed a triangle pattern on daily chart. With the formation of double wick on initial test of support, there was a reversal in price action. There seems to be a strong support at this level. Price broke out of resistance that was tested previously at least twice. However there was some selling on the same day of breakout. Following day price tried to move up but sellers brought it down but not a lot. This gives an ideal entry with low risk. Note the low volume on consolidation before breakout and above average volume on the day of breakout.
Hope you liked my view on NHPC. If you think it was worth your time, please boost this idea.

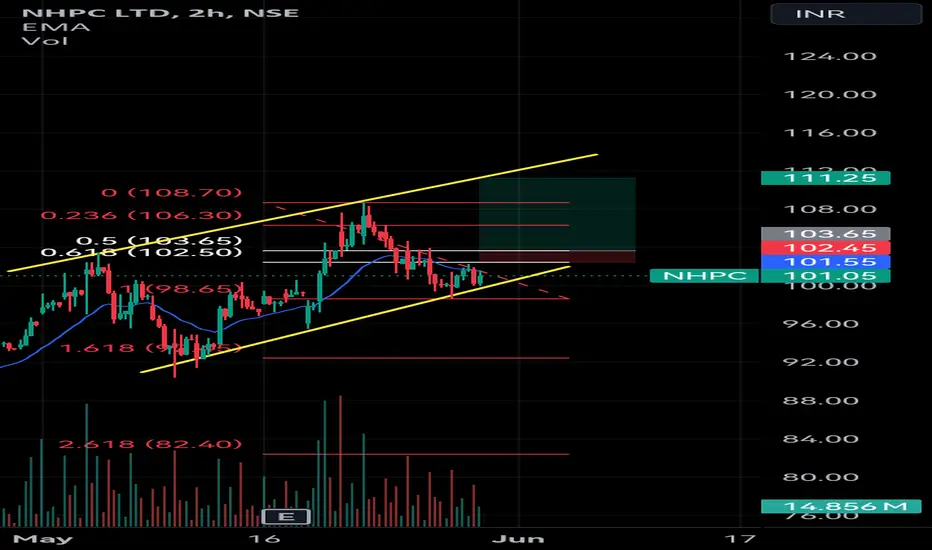
Hhpc completed 0.618 retracement ready for more upsideBig bullish candle on. 618 fib can be bought for further levels
T1-89. 7
92.6
94.4
97.3
100+

Buy NHPC around 30.2 avg @ 27.8 TGT 42/88/115 sl below 24The stock made a good consolidation and operates in Clean energy projects with huge upcoming and current projects especially in Hydro Electricity and Solar Power on reservoirs with book value @0.95 and PE @ 9.38. Technically the stock is also giving a good breakout and in medium term can be a good pick for portfolio. The company is also a mini ratna and have good future potential
