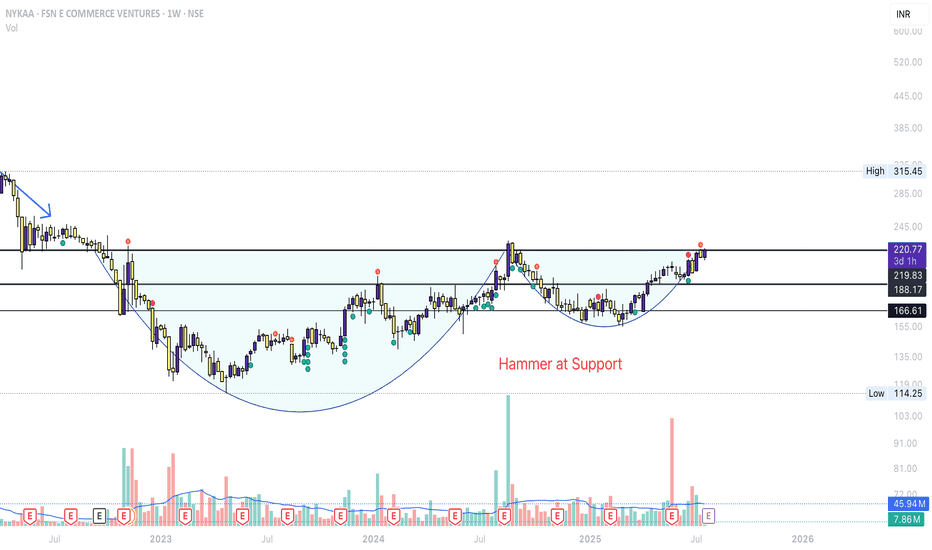
NYKAA trade ideas
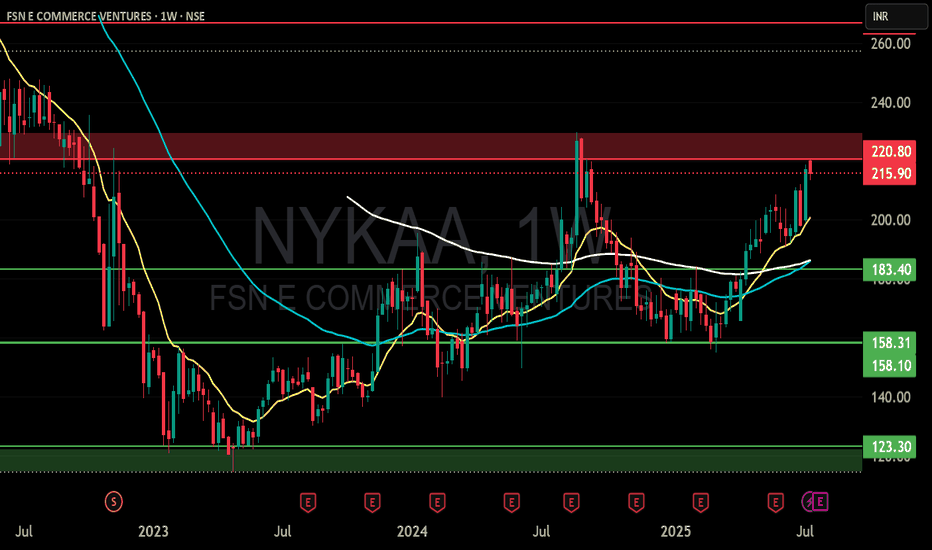
NYKAA (FSN COMMERCE VENTURES) S/RSupport and Resistance Levels:
Support Levels: These are price points (green line/shade) where a downward trend may be halted due to a concentration of buying interest. Imagine them as a safety net where buyers step in, preventing further decline.
Resistance Levels: Conversely, resistance levels (red line/shade) are where upward trends might stall due to increased selling interest. They act like a ceiling where sellers come in to push prices down.
Breakouts:
Bullish Breakout: When the price moves above resistance, it often indicates strong buying interest and the potential for a continued uptrend. Traders may view this as a signal to buy or hold.
Bearish Breakout: When the price falls below support, it can signal strong selling interest and the potential for a continued downtrend. Traders might see this as a cue to sell or avoid buying.
MA Ribbon (EMA 20, EMA 50, EMA 100, EMA 200) :
Above EMA: If the stock price is above the EMA, it suggests a potential uptrend or bullish momentum.
Below EMA: If the stock price is below the EMA, it indicates a potential downtrend or bearish momentum.
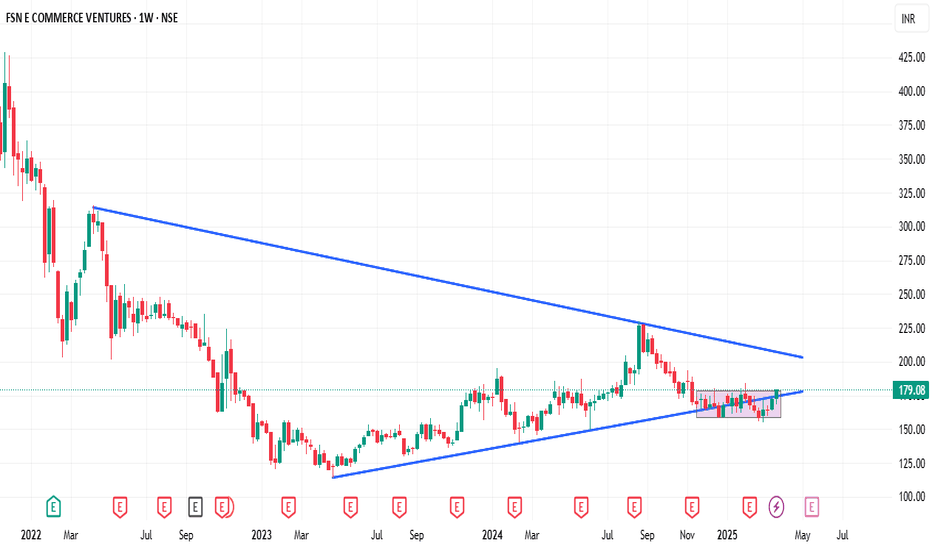
Trendline: A trendline is a straight line drawn on a chart to represent the general direction of a data point set.
Uptrend Line: Drawn by connecting the lows in an upward trend. Indicates that the price is moving higher over time. Acts as a support level, where prices tend to bounce upward.
Downtrend Line: Drawn by connecting the highs in a downward trend. Indicates that the price is moving lower over time. It acts as a resistance level, where prices tend to drop.
Disclaimer:
I am not a SEBI registered. The information provided here is for learning purposes only and should not be interpreted as financial advice. Consider the broader market context and consult with a qualified financial advisor before making investment decisions.
FSN E COMMERCE VENTURES at Best Support Level | NYKAA !!This is the 4 hour Chart of Nykaa.
Nykaa having a good law of polairty near at 195-190 range.
Nykaa is forming ascending boradening wedge pattern with support at 190-195 range .
If this level is sustain , then we may see higher prices in Nykaa .
Thank You !!
NYKAA LONG TRADE SETUP📊 Price Action & Trend Analysis
Analyzing market trends using price action, key support/resistance levels, and candlestick patterns to identify high-probability trade setups.
Always follow the trend and manage risk wisely!
Price Action Analysis Interprets Market Movements Using Patterns And Trends On Price Charts.
👉👉👉Follow us for Live Market Views/Trades/Analysis/News Updates.
NYKAAOn this chart, there are lines called "Fibonacci retrenchment levels," which help predict where the price might go up or down.
Here's the simple breakdown:
The chart shows different levels where the price could stop and change direction. These levels are like markers on the chart.
The blue arrow on the chart suggests that the price might go up.
There's also a note saying that the price might increase.
In short, the chart is trying to predict that the price will go up and shows some important points where it might change direction. If you have any specific questions, feel free to ask!
this can be a false breakdown NSE:NYKAA the break is not reflected in the rsi that means there is hesitation for sellers this should be a false break down however 140/150 is next support zone my own strategy is to accumulate on dips for investment as for reasons to do so one can comment and know my reasons
NykaaTrade Setup:
- crossed resistance of 210 INR and sustained on weekly basis (price trading at support levels).
- 20 EMA crossed (or is above) 50 EMA on weekly basis, and the EMA's are steep in upward direction.
- RSI > 50
- RS is positive (>0)
Buy price = CMP (215 INR). Add on drips until near 50 EMA
Stop loss = trendline
Target = 310 INR


