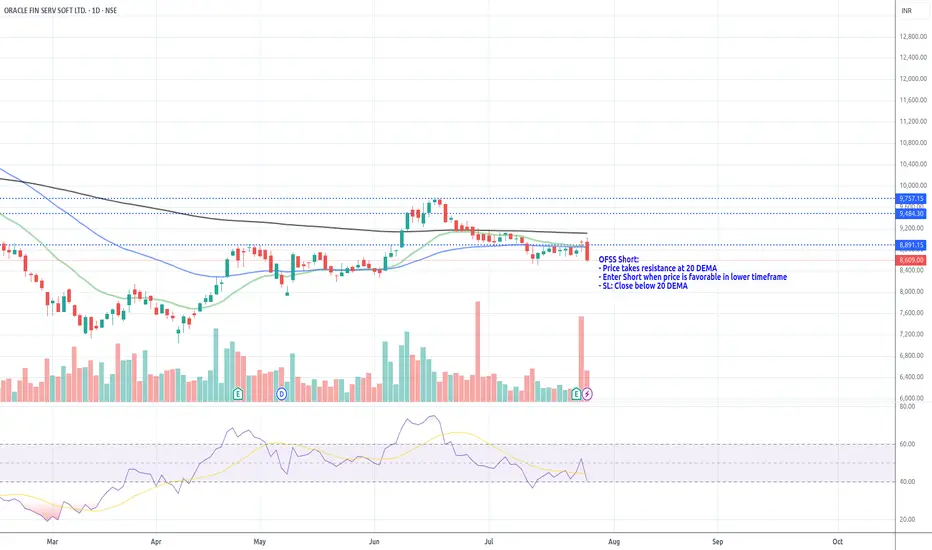
OFSS Short_Resistance @ 20 DEMAOFSS Short:
- Price takes resistance at 20 DEMA
- Enter Short when price is favorable in lower timeframe
- SL: Close below 20 DEMA
Next report date
—
Report period
—
EPS estimate
—
Revenue estimate
—
277.00 INR
23.80 B INR
68.47 B INR
23.66 M
About ORACLE FIN SERV SOFT LTD.
Sector
Industry
CEO
Makarand Shrikant Padalkar
Website
Headquarters
Mumbai
Founded
1989
ISIN
INE881D01027
FIGI
BBG000F48MC4
Oracle Financial Services Software Ltd. is a holding company, which engages in development, sale, and market of computer software and computer systems; and provision of consultancy and other information technology related activities. It operates through the following segments: Product Licenses and Related Activities; and IT Solutions and Consulting Services. The Product Licenses and Related Activities segment deals with banking software products. The IT Solutions and Consulting Services segment offers services comprising the entire lifecycle of applications used by financial service institutions. The company was founded on September 27, 1989 and is headquartered in Mumbai, India.
Related stocks
OFSS📈 Trade Plan (BUY Setup)
Parameter Value
Entry Price 8565
Stop Loss (SL) 8365
Risk 200 pts
Target (Reward) 10234 pts
Target Price 18799
Risk:Reward (RR) 51.2
🔎 Reference Points
Last High: 12809
Last Low: 6819
Point Variation: 5990
✅ Key Takeaways
All trend indicators point strongly bullish from
Oracle Financial Services SellOracle Financial Services breaks below trend line. Sell @CMP (8885) with Sl of 9150 and target of 8350, 7900 & 7300.

ofss rsi breakout cmp : 9030
stoploss : weekly closing below 8780
target :10400
Disclaimer:
This publication is strictly for educational and informational purposes only and should not be construed as investment advice, a trading recommendation, or a solicitation to buy or sell any securities. The analysis and

OFSSOFSS
watch above levels. green line is our entry, redline is our SL.
DISCLAIMER : I am NOT a SEBI registered advisor or a financial adviser. All the views are for educational purpose only.


OFSSTrade Plan ENTRY-1
Entry-1 7984
Entry-2 7418
SL 7353
RISK 631
REWARD 5868
Target as per Entry 13852
RR 9.3
Last High 13221
Last Low 7353
OFSS
MTF MTF-Zone TREND MTF Analysis Logic Proximal Distal Average
HTF Yearly UP OFSSYearly Demand RR 5145 4280 4,713
HTF Half-Yearly UP OFSS6

OFSS Weekly | Bullish Harmonic Reversal & RSI Breakout | Short-T📈 Swing Trade Recommendation (Short-Term):
Buy Zone: ₹8,600–₹8,750 (on dips or on strength)
Target 1: ₹9,300 (initial resistance and round number)
Target 2: ₹10,200–₹10,500 (next harmonic resistance zone)
Stoploss: ₹8,050 (below recent swing low)
🔍 Technical Highlights:
Bullish Harmonic Structur


See all ideas
Summarizing what the indicators are suggesting.
Neutral
SellBuy
Strong sellStrong buy
Strong sellSellNeutralBuyStrong buy
Neutral
SellBuy
Strong sellStrong buy
Strong sellSellNeutralBuyStrong buy
Neutral
SellBuy
Strong sellStrong buy
Strong sellSellNeutralBuyStrong buy
An aggregate view of professional's ratings.
Neutral
SellBuy
Strong sellStrong buy
Strong sellSellNeutralBuyStrong buy
Neutral
SellBuy
Strong sellStrong buy
Strong sellSellNeutralBuyStrong buy
Neutral
SellBuy
Strong sellStrong buy
Strong sellSellNeutralBuyStrong buy
Displays a symbol's price movements over previous years to identify recurring trends.
Frequently Asked Questions
The current price of OFSS is 8,360.90 INR — it has decreased by −1.34% in the past 24 hours. Watch ORACLE FINANCIAL SERVICES SOFT stock price performance more closely on the chart.
Depending on the exchange, the stock ticker may vary. For instance, on BSE exchange ORACLE FINANCIAL SERVICES SOFT stocks are traded under the ticker OFSS.
OFSS stock has fallen by −6.62% compared to the previous week, the month change is a −6.69% fall, over the last year ORACLE FINANCIAL SERVICES SOFT has showed a −25.09% decrease.
We've gathered analysts' opinions on ORACLE FINANCIAL SERVICES SOFT future price: according to them, OFSS price has a max estimate of 10,500.00 INR and a min estimate of 10,500.00 INR. Watch OFSS chart and read a more detailed ORACLE FINANCIAL SERVICES SOFT stock forecast: see what analysts think of ORACLE FINANCIAL SERVICES SOFT and suggest that you do with its stocks.
OFSS reached its all-time high on Dec 30, 2024 with the price of 13,203.60 INR, and its all-time low was 380.00 INR and was reached on May 17, 2004. View more price dynamics on OFSS chart.
See other stocks reaching their highest and lowest prices.
See other stocks reaching their highest and lowest prices.
OFSS stock is 1.60% volatile and has beta coefficient of 1.12. Track ORACLE FINANCIAL SERVICES SOFT stock price on the chart and check out the list of the most volatile stocks — is ORACLE FINANCIAL SERVICES SOFT there?
Today ORACLE FINANCIAL SERVICES SOFT has the market capitalization of 726.59 B, it has increased by 0.44% over the last week.
Yes, you can track ORACLE FINANCIAL SERVICES SOFT financials in yearly and quarterly reports right on TradingView.
ORACLE FINANCIAL SERVICES SOFT is going to release the next earnings report on Oct 23, 2025. Keep track of upcoming events with our Earnings Calendar.
OFSS net income for the last quarter is 6.42 B INR, while the quarter before that showed 6.44 B INR of net income which accounts for −0.31% change. Track more ORACLE FINANCIAL SERVICES SOFT financial stats to get the full picture.
As of Aug 2, 2025, the company has 8.89 K employees. See our rating of the largest employees — is ORACLE FINANCIAL SERVICES SOFT on this list?
EBITDA measures a company's operating performance, its growth signifies an improvement in the efficiency of a company. ORACLE FINANCIAL SERVICES SOFT EBITDA is 30.75 B INR, and current EBITDA margin is 44.93%. See more stats in ORACLE FINANCIAL SERVICES SOFT financial statements.
Like other stocks, OFSS shares are traded on stock exchanges, e.g. Nasdaq, Nyse, Euronext, and the easiest way to buy them is through an online stock broker. To do this, you need to open an account and follow a broker's procedures, then start trading. You can trade ORACLE FINANCIAL SERVICES SOFT stock right from TradingView charts — choose your broker and connect to your account.
Investing in stocks requires a comprehensive research: you should carefully study all the available data, e.g. company's financials, related news, and its technical analysis. So ORACLE FINANCIAL SERVICES SOFT technincal analysis shows the strong sell today, and its 1 week rating is sell. Since market conditions are prone to changes, it's worth looking a bit further into the future — according to the 1 month rating ORACLE FINANCIAL SERVICES SOFT stock shows the neutral signal. See more of ORACLE FINANCIAL SERVICES SOFT technicals for a more comprehensive analysis.
If you're still not sure, try looking for inspiration in our curated watchlists.
If you're still not sure, try looking for inspiration in our curated watchlists.