OSWAL PUMP LTD - DON'T MISS THE UPCOMING PUMPEverything is pretty much explained in the picture itself.
I am Abhishek Srivastava | SEBI-Certified Research and Equity Derivative Analyst from Delhi with 4+ years of experience.
I focus on simplifying equity markets through technical analysis. On Trading View, I share easy-to-understand insights to help traders and investors make better decisions.
Kindly check my older shared stock results on my profile to make a firm decision to invest in this.
Kindly dm for further assistance it is for free just for this stock.
Thank you and invest wisely.
OSWALPUMPS trade ideas
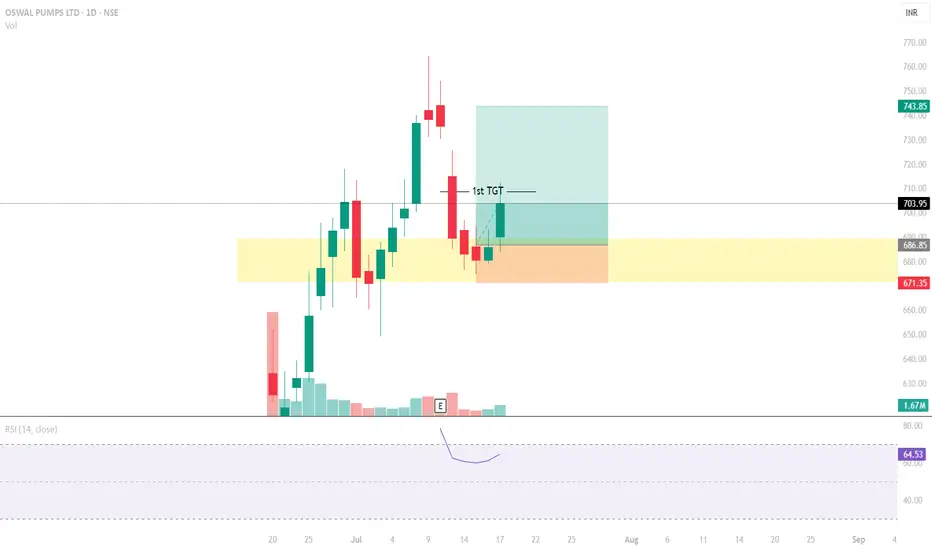
OSWAL PUMPSBased on my earlier prediction, the stock moved in my favour.
Also, i have exited all my positions at 1st TGT level
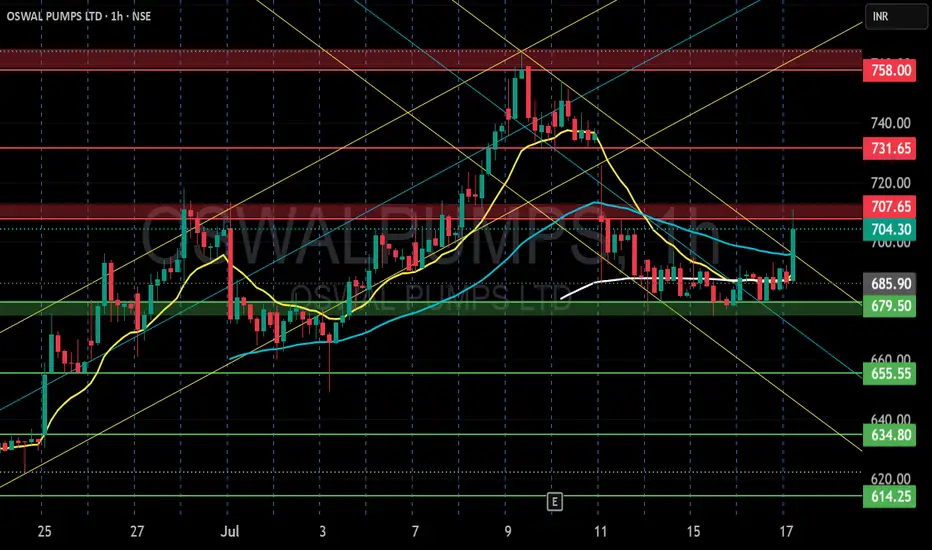
OSWAL PUMPS LTD S/RSupport and Resistance Levels:
Support Levels: These are price points (green line/shade) where a downward trend may be halted due to a concentration of buying interest. Imagine them as a safety net where buyers step in, preventing further decline.
Resistance Levels: Conversely, resistance levels (red line/shade) are where upward trends might stall due to increased selling interest. They act like a ceiling where sellers come in to push prices down.
Breakouts:
Bullish Breakout: When the price moves above resistance, it often indicates strong buying interest and the potential for a continued uptrend. Traders may view this as a signal to buy or hold.
Bearish Breakout: When the price falls below support, it can signal strong selling interest and the potential for a continued downtrend. Traders might see this as a cue to sell or avoid buying.
MA Ribbon (EMA 20, EMA 50, EMA 100, EMA 200) :
Above EMA: If the stock price is above the EMA, it suggests a potential uptrend or bullish momentum.
Below EMA: If the stock price is below the EMA, it indicates a potential downtrend or bearish momentum.
Trendline: A trendline is a straight line drawn on a chart to represent the general direction of a data point set.
Uptrend Line: Drawn by connecting the lows in an upward trend. Indicates that the price is moving higher over time. Acts as a support level, where prices tend to bounce upward.
Downtrend Line: Drawn by connecting the highs in a downward trend. Indicates that the price is moving lower over time. It acts as a resistance level, where prices tend to drop.
Disclaimer:
I am not a SEBI registered. The information provided here is for learning purposes only and should not be interpreted as financial advice. Consider the broader market context and consult with a qualified financial advisor before making investment decisions.
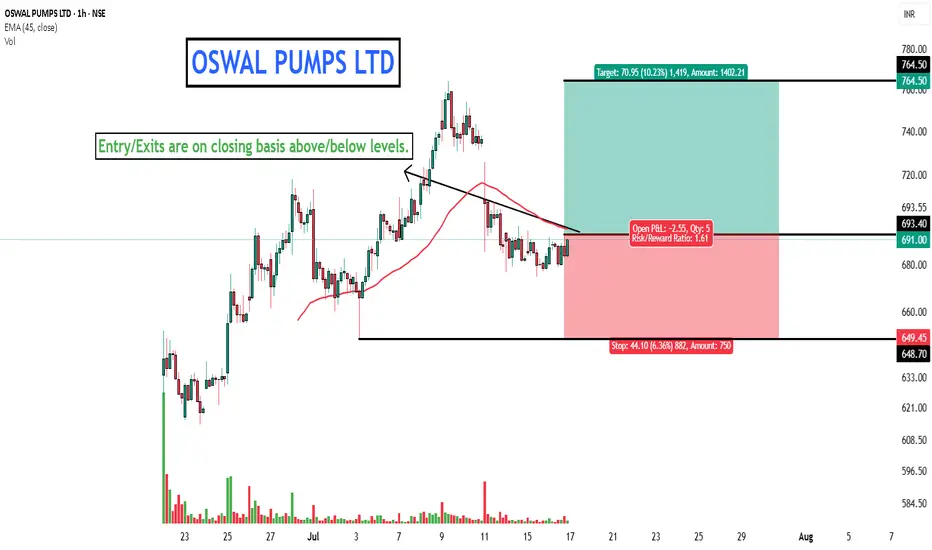
OSWAL PUMPS Long CallIf you have seen my strategy that I used to capture a 1:1.7 RR trade in Mamata Machinery,
Used the same strategy here, but drew fib retracement from low to high,
Currently the price is ranging in the golden zone, and i have entered the trade
SL below the Golden Zone.
Again, this is just my analysis, not a recommendation
