PAGE INDUSTRIES - ready to fly ?? looking strong on hourlyPAGE INDUSTRIES----HOURLY counts indicate Excellent bullish wave structure.
Both appear to be optimistic and this stock invalidation number (S L) wave 2 low
target short / long term are already shared as per charts
correction wave leg seems completed (C)
Investing in declines is a smart move for short/ long-term players.
Buy in DIPS recommended
Long-term investors prepare for strong returns over the next two to five years.
one of best counter
Every graphic used to comprehend & LEARN & understand the theory of Elliot waves, Harmonic waves, Gann Theory, and Time theory
Every chart is for educational purposes.
We have no accountability for your profit or loss.
PAGEIND trade ideas

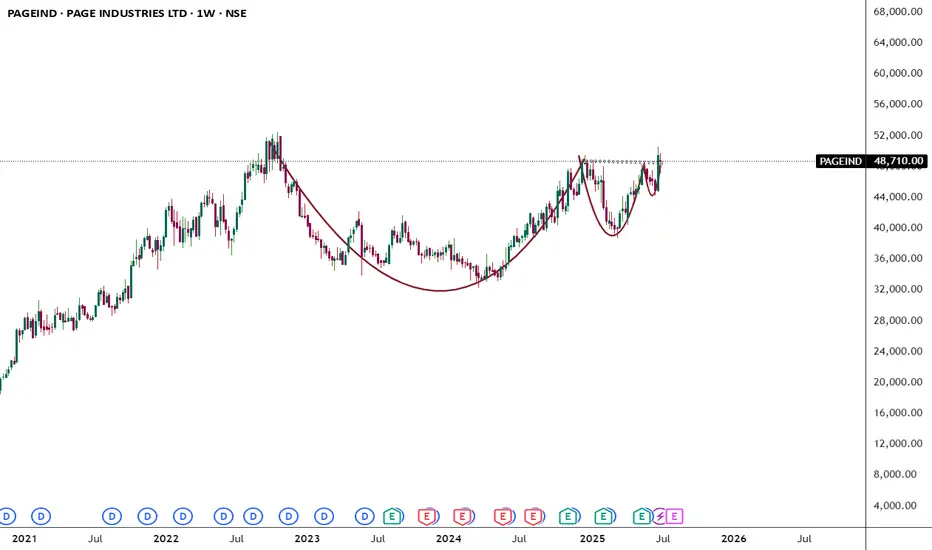
PAGE - LONGNSE:PAGEIND Weekly parabolic formation along with buyers candle and macd turning upside.
May continue trend upward.

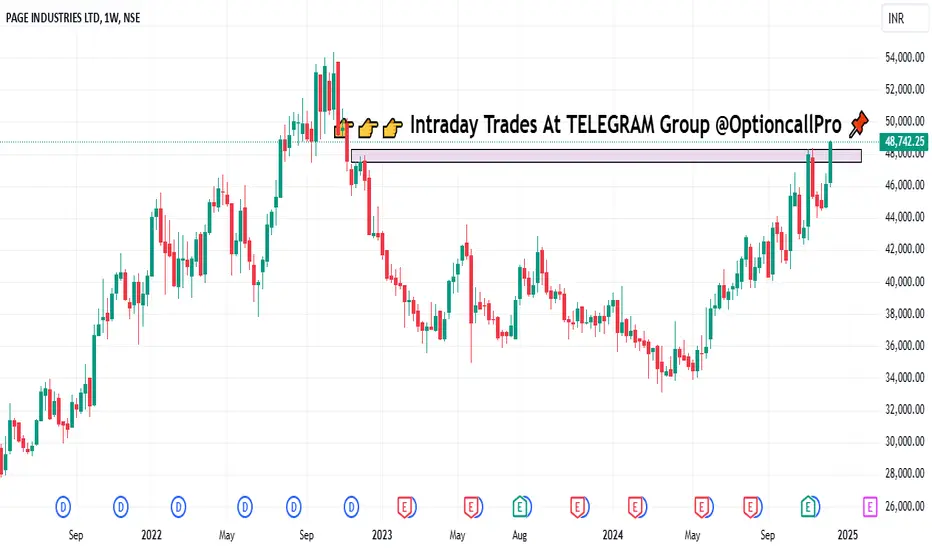
Repeating Pattern in PAGE INDUSTRIES...NSE:PAGEIND trade at 43200 level. Stocks shows its ready for going ALL TIME HIGH LEVEL, on the chart make a Repeating structural chart pattern. So you can watch for an Upside Move.

Amazing breakout on Weekly Timeframe - PAGEINDCheckout an amazing breakout happened in the stock in Weekly timeframe, macroscopically seen in Daily timeframe. Having a great favor that the stock might be bullish expecting a staggering returns of minimum 25% TGT. IMPORTANT BREAKOUT LEVELS ARE ALWAYS RESPECTED!
NOTE for learners: Place the breakout levels as per the chart shared and track it yourself to get amazed!!
#No complicated chart patterns
#No big big indicators
#No Excel sheet or number magics
TRADE IDEA: WAIT FOR THE STOCK TO BREAKOUT IN LOWER TIMEFRAME AND RETRACE IF NEEDED. SL IS NEARER SUPPORT ZONE IN Daily TIMEFRAME.
Checkout an amazing breakout happened in the stock in Weekly timeframe.
Breakouts happening in longer timeframe is way more powerful than the breakouts seen in Daily timeframe. You can blindly invest once the weekly candle closes above the breakout line and stay invested forever. Also these stocks breakouts are lifelong predictions, it means technically these breakouts happen giving more returns in the longer runs. Hence, even when the scrip makes a loss of 10% / 20% / 30% / 50%, the stock will regain and turn around. Once they again enter the same breakout level, they will flyyyyyyyyyyyy like a ROCKET if held in the portfolio in the longer run.
Time makes money, GREEDY & EGO will not make money.
Also, magically these breakouts tend to prove that the companies turn around and fundamentally becoming strong. Also the magic happens when more diversification is done in various sectors under various scripts with equal money invested in each N500 scripts.
The real deal is when to purchase and where to purchase the stock. That is where Breakout study comes into play.
LET'S PUMP IN SOME MONEY AND REVOLUTIONIZE THE NATION'S ECONOMY!

Page industries ltd Swing TradeHello,
Trend-Based Analysis. Buy the Dips, Sell The Rallies, Also Following the Trend. Let's see where the Price Action takes us, Riding the wave. Potential trade setups based on trend momentum.
Technical analysis based on trend identification and momentum, Looking for high-probability setups within the prevailing trend.
Analyzing the current market trend and potential future price movement. Focusing on risk management and reward-to-risk ratios.
Details is Mentioned in Chart, Read carefully.. .
PAGEIND NSE RBC BO 1Y 2W Positional, Trend Line BO SwingSTOCK Analysis
PAGEIND RBC BO
TRADE PLAN
ENTRY -42400
SL -42100
TARGET --01-42900 Swing , TGT01--45500 TGT2-49700
Hold For a Year or TGT 2
Chart Pattern :
STOCK has recently broken out of Bearish Subtrend after hitting a LTH, Now its close to Forming a 1Y-2W RBC on the DTF/WTF. Targets for Swing and Positional Marked on chart
INDICATORS EMA :
The Price is Currently Trading above 20EMA, and 20EM crossed above 50EMA in June in DTF. STOCK EMAs are currently aligned in a ascending order 200 to 20 indicating a bullish Trend on DTF/WTF.
FIBO E :
NA
Volumes: Not Very Significant currently
Keep in your Priority Watch List
Disclaimer: For Education/Reference Purpose Only, Trade at your Own Risk with correct position sizing and SL based on your Risk apetite (Exit when price closes 7to8% below your Entry).
Trail Your SL progressively. Learn/Know and Review the Stock trading Technical Terminology. Check Verify the Financial fundamentals of the Stock and Seek Advice from a Certified Financial Advisor prior to Investing. Prefer Entry with 25% quantity, Add in Tranches of 25%-50% as prices moves upwards recommended.
MTFA- Multiple Time Frame Analysis
DTF -Daily Time Frame
WTF-Weekly Time Frame
MTF- Monthly Time Frame
ATH-All Time High
LTH -LifeTime High
RBC&H-Rounding Bottom Cup/Handle
BO- Breakout Close
EMA -Exponential Moving Average
FIBO R/E -Trend based Fibonacci Retracement/Extension
SL Stop Loss
TBD- To be Decided
CHoCH- Change of Character Bullish/Bearish
MSB/BOS -Break Out Structure
FVG Fair Value Gap
20VMA -20Volume Moving Average
SWING/POSITIONAL Trade

CLOSED BELOW RESISTANCEYou shold be carefull PAGE INDUSTRIES is nearby resistance can be retrace don't trade carelessely to loose your hard earned money.

PAGEINDNSE:PAGEIND
One Can Enter Now !
Or Wait for Retest of the Trendline (BO) !
Or wait For better R:R ratio !
Note :
1.One Can Go long with a Strict SL below the Trendline or Swing Low.
2. R:R ratio should be 1 :2 minimum
3. Plan as per your RISK appetite and Money Management.
Disclaimer : You are responsible for your Profits and loss, Shared for Educational purpose

PAGE INDUSTRIES LTD S/RSupport and Resistance Levels:
Support Levels: These are price points (green line/shade) where a downward trend may be halted due to a concentration of buying interest. Imagine them as a safety net where buyers step in, preventing further decline.
Resistance Levels: Conversely, resistance levels (red line/shade) are where upward trends might stall due to increased selling interest. They act like a ceiling where sellers come in to push prices down.
Breakouts:
Bullish Breakout: When the price moves above resistance, it often indicates strong buying interest and the potential for a continued uptrend. Traders may view this as a signal to buy or hold.
Bearish Breakout: When the price falls below support, it can signal strong selling interest and the potential for a continued downtrend. Traders might see this as a cue to sell or avoid buying.
20 EMA (Exponential Moving Average):
Above 20 EMA(50 EMA): If the stock price is above the 20 EMA, it suggests a potential uptrend or bullish momentum.
Below 20 EMA: If the stock price is below the 20 EMA, it indicates a potential downtrend or bearish momentum.
Trendline: A trendline is a straight line drawn on a chart to represent the general direction of a data point set.
Uptrend Line: Drawn by connecting the lows in an upward trend. Indicates that the price is moving higher over time. Acts as a support level, where prices tend to bounce upward.
Downtrend Line: Drawn by connecting the highs in a downward trend. Indicates that the price is moving lower over time. It acts as a resistance level, where prices tend to drop.
RSI: RSI readings greater than the 70 level are overbought territory, and RSI readings lower than the 30 level are considered oversold territory.
Combining RSI with Support and Resistance:
Support Level: This is a price level where a stock tends to find buying interest, preventing it from falling further. If RSI is showing an oversold condition (below 30) and the price is near or at a strong support level, it could be a good buy signal.
Resistance Level: This is a price level where a stock tends to find selling interest, preventing it from rising further. If RSI is showing an overbought condition (above 70) and the price is near or at a strong resistance level, it could be a signal to sell or short the asset.
Disclaimer:
I am not a SEBI registered. The information provided here is for learning purposes only and should not be interpreted as financial advice. Consider the broader market context and consult with a qualified financial advisor before making investment decisions.

Page Industries LongPage Industries - Set ups
MTF Analysis
Page Industries Yearly Demand Beakout 36370
Page Industries 6 Month Demand Breakout 36370
Page Industries Qtrly Demand BUFL 34876
Page Industries Monthly Demand BUFL 34876
Page Industries Weekly Demand 39454
Page Industries Daily Demand DMIP 44248
ENTRY -1 44248
SL 43796
RISK 452
Taget as per Entry 47262
Target return 7%
Points to Gain 3014
Latest Last Swing High 46810
Latest Last Swing Low 43796

Review and plan for 11th October 2024Nifty future and banknifty future analysis and intraday plan in kannada.
This video is for information/education purpose only. you are 100% responsible for any actions you take by reading/viewing this post.
please consult your financial advisor before taking any action.
----Vinaykumar hiremath, CMT

INVESTMENT IDEA - PAGE INDUSTRIESPage Industries presents a compelling investment opportunity, supported by both technical indicators and robust fundamentals.
Reasons are listed below :
Technical strengths :
The psychological level of 35,000 has shifted from a resistance point to a strong support level, reflecting market confidence in the company's prospects.
The formation of a hammer candlestick pattern on the weekly chart signals a potential reversal from a downtrend, indicating buyer support at lower price levels.
Finding support at the 0.5 Fibonacci retracement level suggests a healthy correction within an overall uptrend, reinforcing investor confidence.
Page Industries' stock price is supported by the 200 Exponential Moving Average (EMA) on the weekly timeframe, highlighting its stability even during market fluctuations.
Fundamental Strengths:
With well-established brands like Jockey and Speedo, Page Industries maintains a competitive edge and market leadership.
Consistent revenue growth and profitability underscore the company's financial health and prudent management.
Strategic partnerships and expansion efforts enhance Page Industries' market presence and growth prospects.
Page Industries' focus on product quality, innovation, and customer satisfaction ensures its offerings remain relevant and competitive.
Target - 43000 // 53000 // 67000
Stoploss - monthly close below 27000

Page Industry-Nice BreakoutPage Industry-Nice Breakout
Capital to be deployed -50k
Investing Price-43250
Breakout Price -43250
Stoploss -40090
Targets -48000-51000
#StockMarketindia #StockToWatch #StocksInFocus #stockstowatch #StocksToTrade #pageindustry

Page Industries Jockey India at SupportPage Industries has been the most significant story of the last decade and it has built an irreplaceable Brand Name and reputation for itself. There have been very rare opportunities when the stock had corrected so much from the top and every time it did, proved to be a good opportunity for investors to make money with safety of a high growth company with outstanding fundamentals and financials.
The margin pressure in the recent quarters due to high raw material cost has been the reason behind fall. The condition has normalized and we ought to see a very good expansion in Operating Margin in the upcoming result.
Refer the chart for levels.

Page industries strong breakout Last published idea was not having full chart. So publishing it again.
Page is hitting this resistance multiple times and this time consolidating near resistance for a powerful breakout

PAge industriesLooks like a powerful breakout this time. Hitting this price area multiple times and now getting ready to break it.

PAGEINDSupport and Resistance Levels: In technical analysis, support and resistance levels are significant price levels where buying or selling interest tends to be strong. They are identified based on previous price levels where the price has shown a tendency to reverse or find support.

PAGEIND BUY OPPORTUNITYWonderful opportunity to include Page Ind in your portfolio. The chart's target and stop loss marked.
Maintain a stop loss of 1% of the total.

Upside Break out for " Page Industries "There is a Clear Route for upside Break on 24th May 2024 , this will Rally up to 38k, Strong Support & Strong Resistance which can be for Profit booking

PAGE INDUSTRIES LTD - CYCLEIt seems PAGE INDUSTRIES one Elliott wave cycle is going to finish. The wave 2 is under progress. Price may be seen near 50-61.8% range of wave 1.
This is not a buy sell recommendation, please do your own research to enter any trade.
Thank you for watching this please follow for more such ideas.
Regards

[Positional] Page India Buy IdeaNote -
One of the best forms of Price Action is to not try to predict at all. Instead of that, ACT on the price. So, this chart tells at "where" to act in "what direction. Unless it triggers, like, let's say the candle doesn't break the level which says "Buy if it breaks", You should not buy at all.
=======
I use shorthands for my trades.
"Positional" - means You can carry these positions and I do not see sharp volatility ahead. (I tally upcoming events and many small kinds of stuff to my own tiny capacity.)
"Intraday" -means You must close this position at any cost by the end of the day.
"Theta" , "Bounce" , "3BB" or "Entropy" - My own systems.
=======
I won't personally follow any rules. If I "think" (It is never gut feel. It is always some reason.) the trade is wrong, I may take reverse trade. I may carry forward an intraday position. What is meant here - You shouldn't follow me because I may miss updating. You should follow the system I share.
=======
Like -
Always follow a stop loss.
In the case of Intraday trades, it is mostly the "Day's High".
In the case of Positional trades, it is mostly the previous swings.
I do not use Stop Loss most of the time. But I manage my risk with options as I do most of the trades using derivatives

PAGEIND_05FEB2024Page Industries 36761 and 50 % fibo retracement on charts and now its a huge reversal soon. Maintain strict stoploss.
