Paytm : Monthly Time Frame, Sitting at a major Red Band Resistan
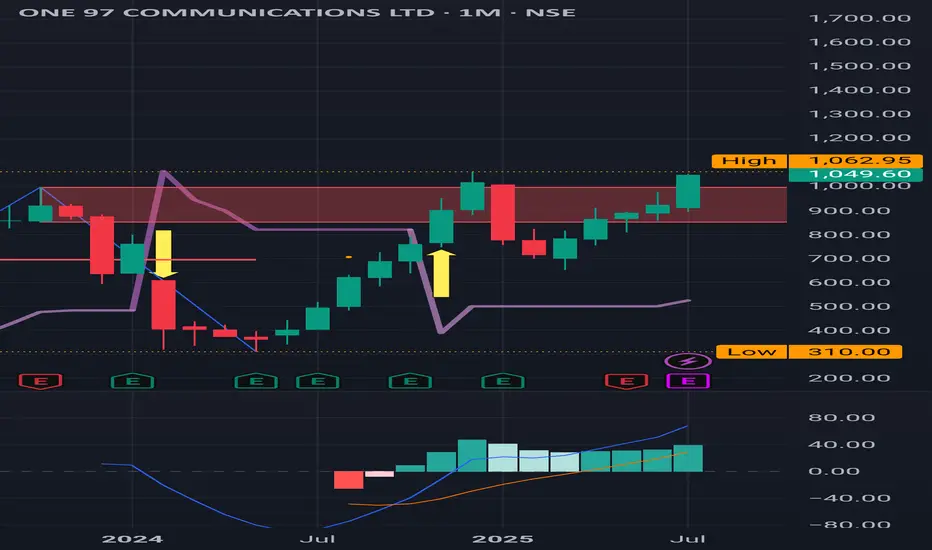
Paytm : Monthly Time Frame, Sitting at a major Red Band Resistance.
Last timr it turned back from 1062 , very important level to test .
( Not a Buy / Sell Recommendation
Do your own due diligence ,Market is subject to risks, This is my own view and for learning only .)
PAYTM trade ideas
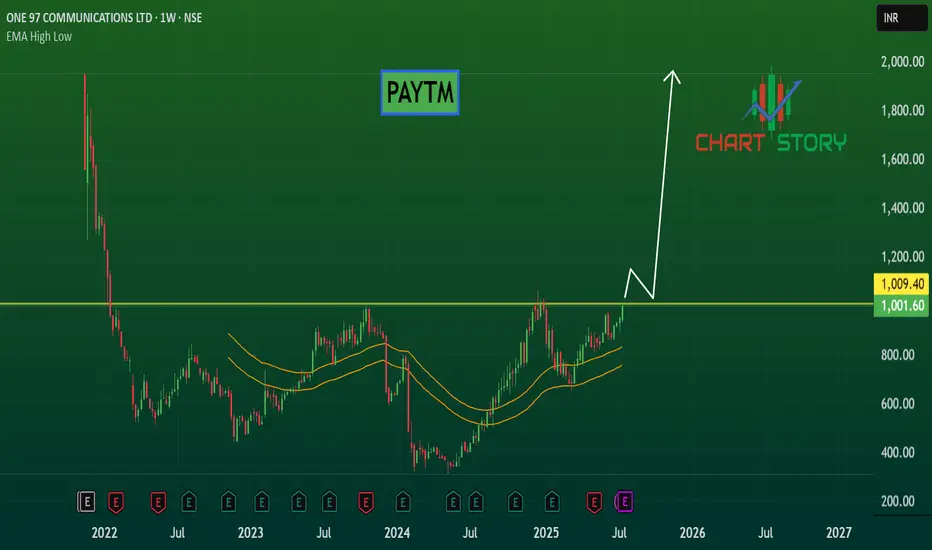
PAYTM - FINAL LAPNSE:PAYTM Weekly price action looks like once final lap crossing it looks like price will double in short span of time.
A long-term hold: PAYTM stockHello,
One 97 Communications Ltd. or PAYTM engages in the development of digital goods and mobile commerce platform. It operates through the following segments: Payment, Commerce, Cloud, and Others. The company was founded by Vijay Shekhar Sharma on December 22, 2000 and is headquartered in Noida, India.
The company's revenue continues to grow over time. During the 4th Quarter ended 31st March 2025, PAYTM reported revenu of $224M up from $214Mn in the previous quarter (Up 5% QoQ). The company is also now close to break-even from a profit after tax metric. PAT* of $(3) Mn, an improvement of $22 Mn QoQ. The business generated a net payment margin of $68mn including UPI incentive.
To continue driving value growth, the company states that they will be focusing on the below pillars;
Merchant payments
Consumer acquisition
International business
Financial services
Looking at the The Paytm Q4 FY25 report reveals several compelling opportunities for growth and profitability. The expanding merchant ecosystem, now at 12.4 million devices, provides a strong foundation for deeper financial services penetration, particularly merchant lending, which has seen consistent growth and high repeat rates. With India’s MSME sector largely underpenetrated in digital payments, there is a vast opportunity to deploy innovative payment solutions, especially in tier-2 and tier-3 cities. Additionally, the company’s focus on new products like the Solar and Mahakumbh Soundbox positions it well to enhance merchant engagement and retention. The financial services segment, buoyed by better asset quality and growing lender partnerships, offers room for scale in both lending and wealth management. Furthermore, regulatory prospects such as the introduction of MDR on UPI payments for large merchants could open new monetization pathways. International expansion, though longer-term, presents another avenue for replicating Paytm’s tech-driven financial services model in other markets.
While the situation looks positive, there are a few risks for this company.
Regulatory uncertainty
Credit cycle sensitivity
Competitive pressure
Security risks as Paytm scales its plartforms.
Dependence on incentives
The above risks are likely to delay or limit Paytm’s ability to achieve sustained profitability and growth across its payment, lending, and financial services segments. From a technical perspective, we see PAYTM as a long term buy or hold seeing long term opportunity for massive growth in the company.
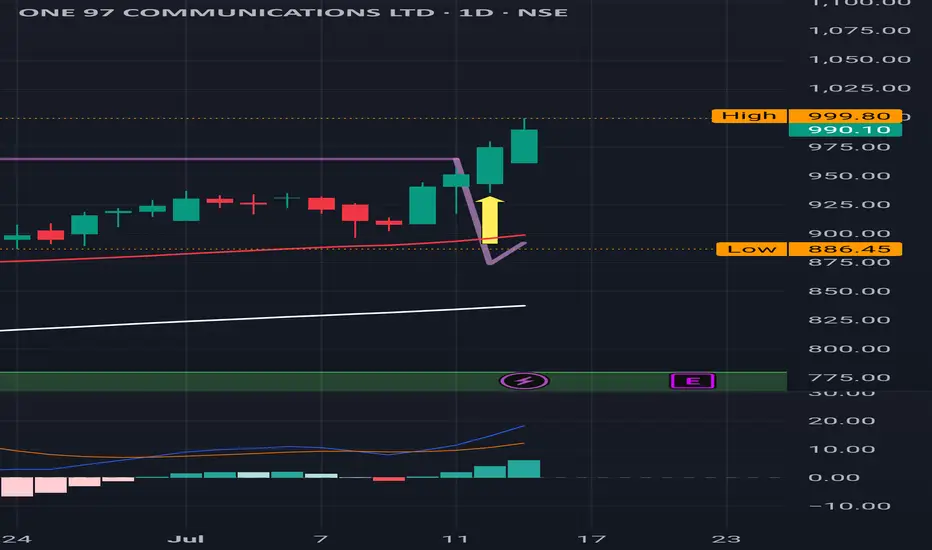
Paytm : Buy Triggered ,next level to watch for is 1062
Paytm : Buy Triggered ,next level to watch for is 1062.
( Not a Buy / Sell Recommendation
Do your own due diligence ,Market is subject to risks, This is my own view and for learning only .)
Paytm : It has cleared the major resistance level of 1062 Paytm : It has cleared the major resistance level of 1062 .
It's already in a Buy trajectory.
( Not a Buy / Sell Recommendation
Do your own due diligence ,Market is subject to risks, This is my own view and for learning only .)
PAYTM - 3 WHITE SOLDIERSNo. of Candles: 3
Trend Context: Appears after a downtrend or consolidation (best)
Body Size: Long real bodies (bullish)
Wicks: Small or nonexistent lower wick
Volumes: > avg of 10 days
My criteria for spotting 3 white soldiers -
Each candle needs to opens within or slightly below the previous candle’s body and closes higher than the previous candle.
The candles also have a small or no lower shadow, indicating consistent buying pressure.
High on volumes

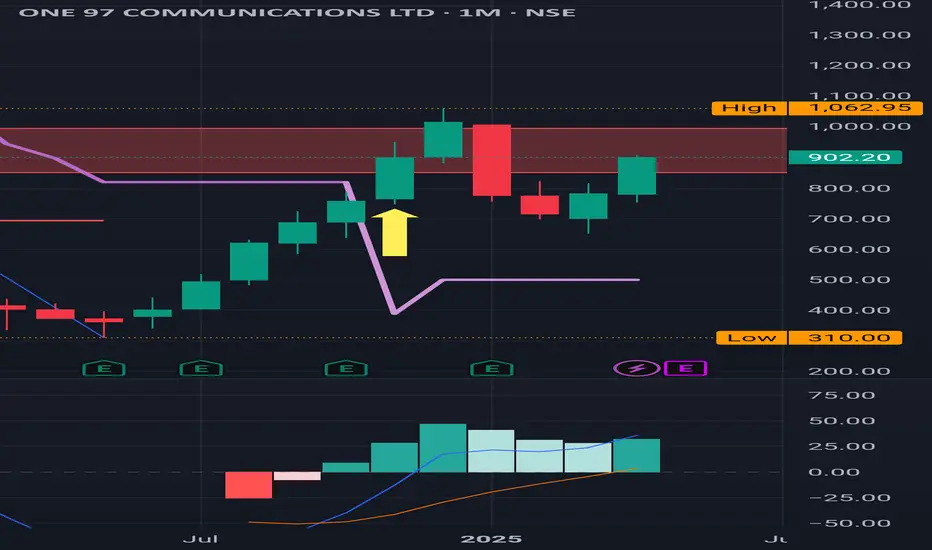
Paytm : Sitting at a Major Red Band Resistance (Monthly Time )Paytm : Sitting at a Major Red Band Resistance.
Last time it turned back from 1062
( Monthly Time Frame)
( Not a Buy / Sell Recommendation
Do your own due diligence ,Market is subject to risks, This is my own view and for learning only .)

PAYTM : Monthly Time Frame.Red Band Resistance
PAYTM : Monthly Time Frame. Red Band Resistance.
( Not a Buy / Sell Recommendation
Do your own due diligence ,Market is subject to risks, This is my own view and for learning only .)

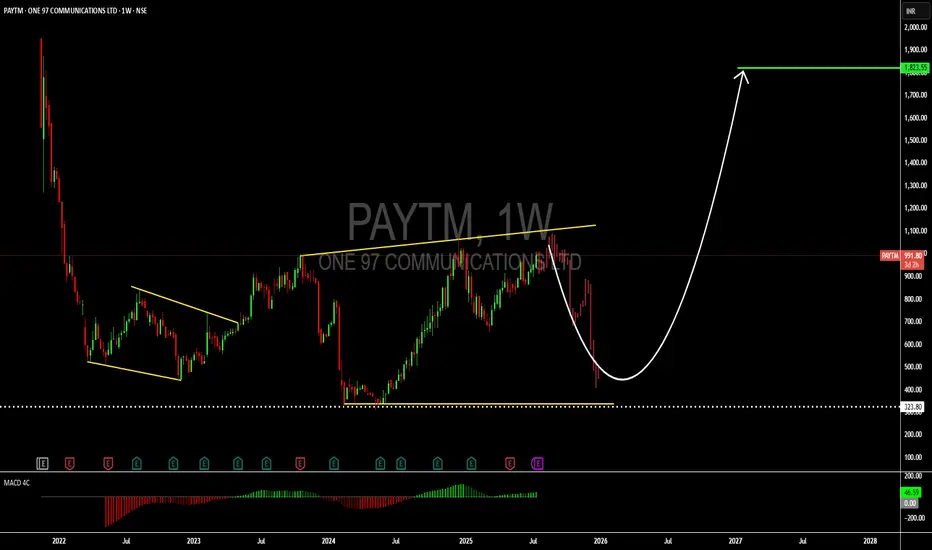
Paytm going to boom like Zomotoyes, as per my analaysis paytm frnd of zomoto company going to boom as per my technical i am expecting 1950 target in comming days

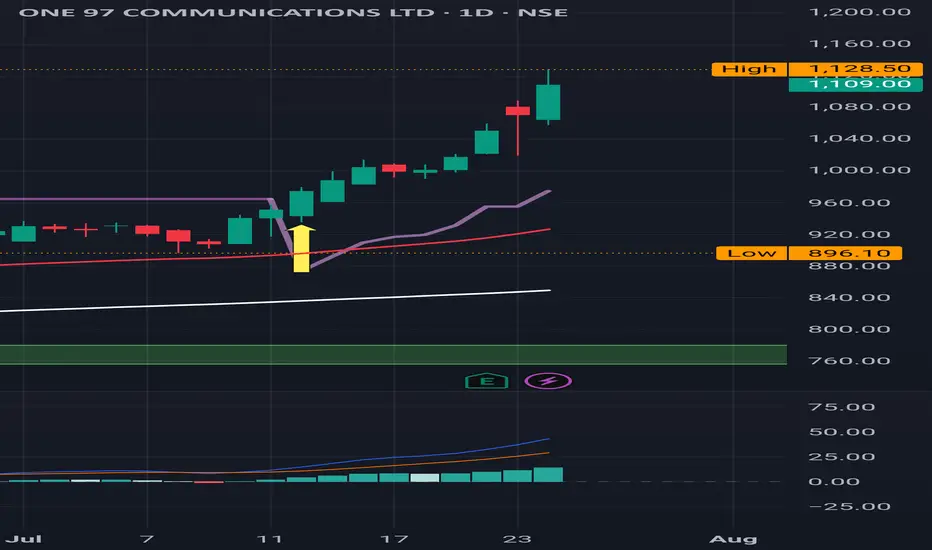
PAYTM - The Stock to Watch - Classic VCP Formation - No AdvicePaytm with first contraction of about 30%, second contraction of about 13% tried to breakout on 2nd June but closing was not very convincing. It failed due to escalation in middle east crises. Now formaing a narrow base with volume also drying up. It is leading to the formation of classic VCP pattern and may lead to Minervini low pivot Cheat entry if closed above 896 with supporting volumes.

Paytm_Rejection @ 20 & 50 Daily EMA_ShortPrice rejection at 20 DEMA and close below 50 DEMA
Short when the price favorable in lower timeframe (Swing high)
Target 825; SL- Today's High/ Close above 50 DEMA

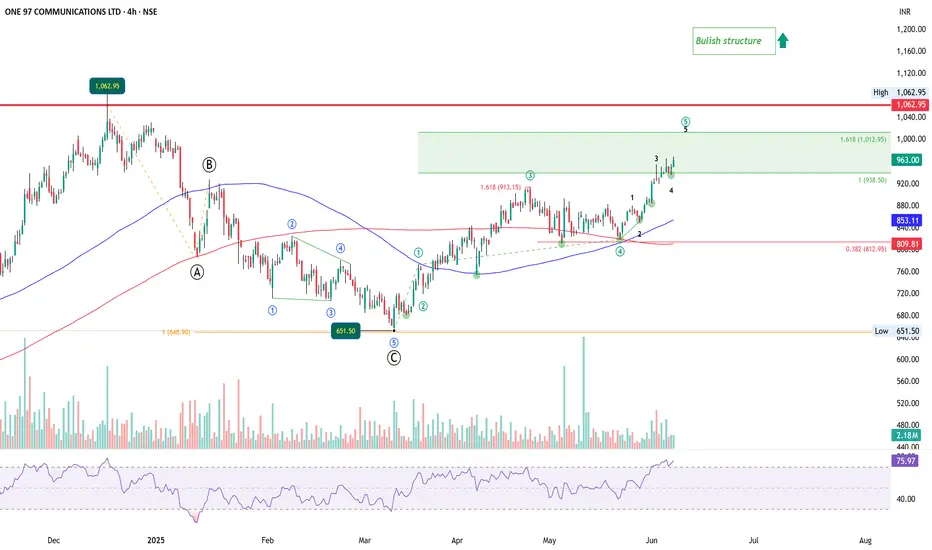
Paytm Approaching Key Zone – Bullish Impulse Nearing MaturityAfter completing an ABC correction at ₹651.50, Paytm (One 97 Communications) has formed a clean 5-wave impulsive move upward. The current structure shows Wave 5 progressing, with internal subwaves 1-2-3-4-5 clearly visible within it.
The projected target zone for Wave 5 lies between ₹938.50 and ₹1,012.95, derived from 1x and 1.618x of Wave 1 measured from Wave 4. Price is currently trading near ₹963 – right inside this key confluence zone.
Volume picked up during Wave 4 and has continued into Wave 5, showing continued interest from participants.
RSI is in overbought territory (~76) and has not confirmed the new high, hinting at potential bearish divergence.
Price remains above both the 100 and 200 SMAs, confirming the overall bullish structure. However, with momentum showing signs of fatigue, a short-term pullback may follow as Wave 5 nears exhaustion.
Chart will be updated as price action evolves.
Disclaimer: This analysis is for educational purposes only and does not constitute investment advice. Please do your own research (DYOR) before making any trading decisions.
PAYTMSEBI-Disclosure for Stock Analysis
For Informational Purposes Only: The analysis provided above is for educational and informational purposes only and is based on the technical interpretation of the supplied stock chart. It should not be construed as financial advice, investment advice, or a recommendation to buy, sell, or hold any security.
Not a Financial Advisor: I am an AI assistant and not a registered or qualified financial advisor, investment advisor, or stockbroker. The information presented is generated without considering your individual financial situation, risk tolerance, or investment objectives.
Risk of Loss: Trading and investing in financial markets, including equities, carry a significant risk of loss. The value of stocks can fluctuate, and you may lose part or all of your investment. Past performance is not indicative of future results.
Consult a Professional: Before making any investment decisions, you should conduct your own thorough research and/or consult with a qualified financial professional to assess your personal circumstances and the suitability of any investment.
Information Accuracy: While this analysis is based on the data visible in the chart, it does not account for all possible market variables, including fundamental factors (like company earnings, debt, management) or macroeconomic events (like interest rate changes, government policies) that can impact the stock's price.
PAYTM : Sitting at a major resistance PAYTM : Sitting at a Major Red Band Resistance . 1000/1062
Monthly Time Frame Chart
( Not a Buy / Sell Recommendation
Do your own due diligence ,Market is subject to risks, This is my own view and for learning only .)

PAYTM : Excellent rally in a Year ,sitting at a major resistancePAYTM : Excellent rally in a Year ,sitting at a major Red Band resistance as displayed in the chart .
(This is a Monthly time frame Chart )
( Not a Buy / Sell Recommendation
Do your own due diligence ,Market is subject to risks, This is my own view and for learning only .)


Paytm Ltd view for Intraday 27th May #paytmPaytm Ltd view for Intraday 27th May #paytm
Resistance 875 Watching above 876 for upside momentum.
Support area 860 Below 870 ignoring upside momentum for intraday
Watching below 858 for downside movement...
Above 870 ignoring downside move for intraday
Charts for Educational purposes only.
Please follow strict stop loss and risk reward if you follow the level.
Thanks,
V Trade Point

PAYTM view for Intraday 13th May #PAYTM PAYTM view for Intraday 13th May #PAYTM
Resistance 870-871 Watching above 871 for upside movement...
Support area 855-860 Below 865 ignoring upside momentum for intraday
Watching below 855 for downside movement...
Above 865 ignoring downside move for intraday
Charts for Educational purposes only.
Please follow strict stop loss and risk reward if you follow the level.
Thanks,
V Trade Point

PayTM: Kabhi Mat karoloss making
Q4 still not declared
Byju folded
Unicorn getting smashed day and day

Paytm : On a Monthly time frame sitting at the resistance Paytm : On a Monthly time frame sitting at the major resistance .
Fantastic run from the support level as visible on the chart . Now sitting at the major resistance on a Monthly time frame
It's already in a Buy trajectory on a daily time frame .
( Not a Buy / Sell Recommendation
Do your own due diligence ,Market is subject to risks, This is my own view and for learning only .)
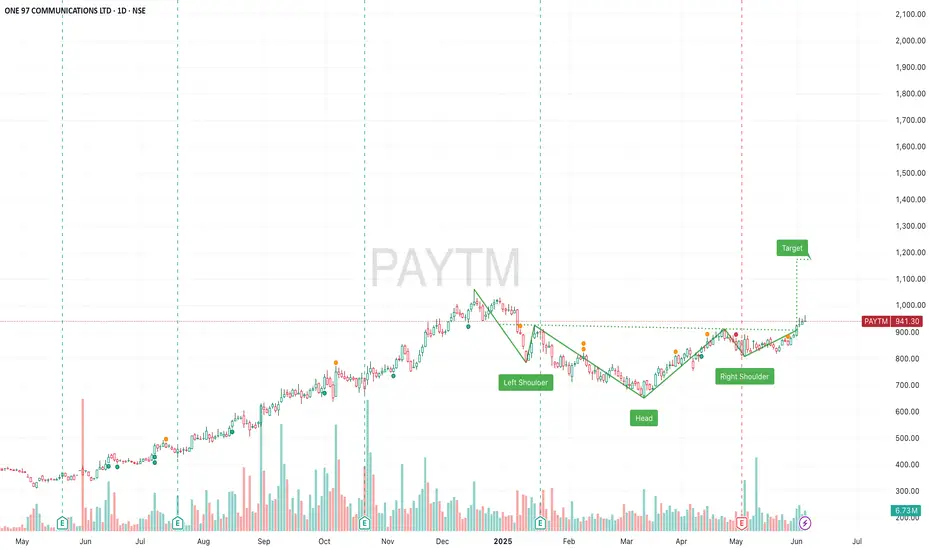
PAYTM - Inverse head and shoulder BO Buy @current price. Retrace also done! Let's take a bet.
Trgt 1: 927
Trgt 2: 1000
SL 800
This is just for Education purpose

PAYTM : Continues it's winning momentum PAYTM : Continues it's winning momentum
Already in a Buy trajectory.
All indicators are suggestive of a bullish trend.
Picked up quite well after the recent turmoil.
( Not a Buy / Sell Recommendation
Do your own due diligence ,Market is subject to risks, This is my own view and for learning only .)

Paytm : Buy triggered Paytm : Buy triggered ,although it's close to a first resistance level of 825.
Be mindful.
Nearby resistance levels to watch for are :
830,930,1030
( Not a Buy / Sell Recommendation
Do your own due diligence ,Market is subject to risks, This is my own view and for learning only .)
