PCBLi Observed these Levels based on Price Action and Demand & Supply which is my own Concept "PENDAM CONCEPTS"... Please don't take any trades based on this chart/post... Because this chart is for educational purpose only not for Buy or Sell Recommendation... Thank Q
PCBL trade ideas

PCBL STRONG BREAKOUT Cash Call:
PCBL
Buy above 437.0
TGT 450.0
Stoploss 428.0
All data given here only for education Purpose Only

PCBLIf the stock price is 400 up than Fresh entry created but if you are confirmation than 400 up than retest after support than you can enter this stock !
I am not Sebi register !

PCBL 461 is good up sideWeekly chart displays breakout
The neckline of inverse XABCD pattern confluence
with the upper side of the symmetrical triangle.
price is based at strong support neckline
this chart clearly shows that a massive potential targets ahead
it will be the level Study and buy
only for
Education purpose

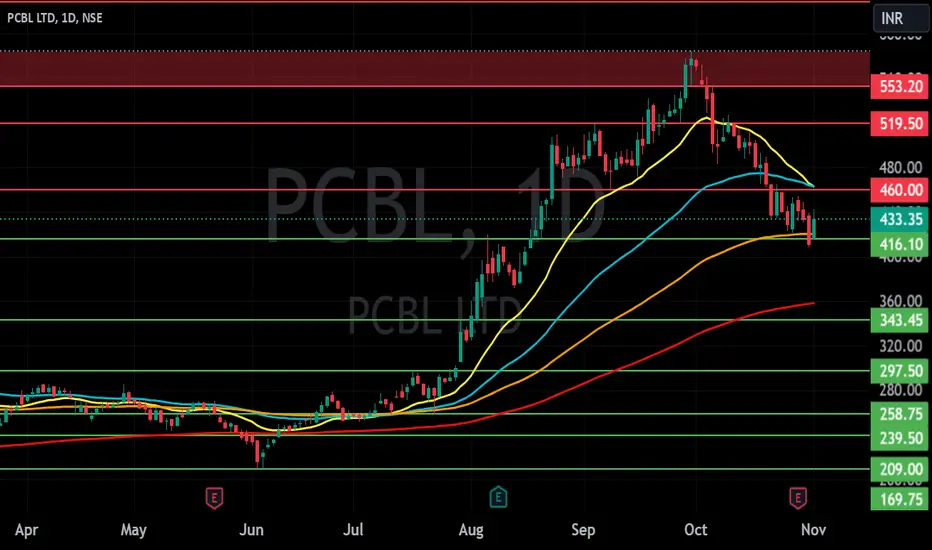
PEBL LTD S/RSupport and Resistance Levels:
Support Levels: These are price points (green line/shade) where a downward trend may be halted due to a concentration of buying interest. Imagine them as a safety net where buyers step in, preventing further decline.
Resistance Levels: Conversely, resistance levels (red line/shade) are where upward trends might stall due to increased selling interest. They act like a ceiling where sellers come in to push prices down.
Breakouts:
Bullish Breakout: When the price moves above resistance, it often indicates strong buying interest and the potential for a continued uptrend. Traders may view this as a signal to buy or hold.
Bearish Breakout: When the price falls below support, it can signal strong selling interest and the potential for a continued downtrend. Traders might see this as a cue to sell or avoid buying.
20 EMA (Exponential Moving Average):
Above 20 EMA(50 EMA): If the stock price is above the 20 EMA, it suggests a potential uptrend or bullish momentum.
Below 20 EMA: If the stock price is below the 20 EMA, it indicates a potential downtrend or bearish momentum.
Trendline: A trendline is a straight line drawn on a chart to represent the general direction of a data point set.
Uptrend Line: Drawn by connecting the lows in an upward trend. Indicates that the price is moving higher over time. Acts as a support level, where prices tend to bounce upward.
Downtrend Line: Drawn by connecting the highs in a downward trend. Indicates that the price is moving lower over time. It acts as a resistance level, where prices tend to drop.
RSI: RSI readings greater than the 70 level are overbought territory, and RSI readings lower than the 30 level are considered oversold territory.
Combining RSI with Support and Resistance:
Support Level: This is a price level where a stock tends to find buying interest, preventing it from falling further. If RSI is showing an oversold condition (below 30) and the price is near or at a strong support level, it could be a good buy signal.
Resistance Level: This is a price level where a stock tends to find selling interest, preventing it from rising further. If RSI is showing an overbought condition (above 70) and the price is near or at a strong resistance level, it could be a signal to sell or short the asset.
Disclaimer:
I am not a SEBI registered. The information provided here is for learning purposes only and should not be interpreted as financial advice. Consider the broader market context and consult with a qualified financial advisor before making investment decisions.
PCBL : Key Highlights and Technical AnalysisCompany Overview:
PCBL Limited stands as a market leader in the carbon black industry, renowned for its focus on innovation and sustainable practices. Over the last five years, the company has demonstrated consistent growth in both revenue and profitability, showcasing its solid foundation and long-term potential.
Financial Highlights:
Buying Range: ₹400 - 436
Target: ₹604 - 628
Revenue: Increased from ₹3,244 Cr (FY20) to ₹6,418 Cr (FY24)
Net Profit: Grew from ₹287.50 Cr (FY20) to ₹491.11 Cr (FY24)
EPS: Adjusted from ₹16.63 (FY20) to ₹13.01 (FY24) due to stock dilution
ROE: Improved from 15.22% (FY20) to 16.07% (FY24), indicating stronger shareholder returns
P/E Ratio: Increased from 12.34 (FY20) to 16.42 (FY24), reflecting investor confidence
Projected earnings for the next financial year are expected to reach approximately ₹400 Cr, further underscoring growth potential.
Technical Analysis:
Currently, PCBL Limited is trading within a golden support zone, positioned between 113% and 127% of the correction from the last swing. This is a critical support area often viewed by investors as an ideal entry point for positions with high upside potential.
Key Technical Insights:
Trend Analysis: PCBL’s current position within the golden support zone is a strong bullish signal, suggesting a reversal towards an upward trend. This support area has historically offered robust support and marked the start of new upswings.
Risk-Reward Ratio: Given its placement near support, the risk-reward ratio for PCBL is favourable. Investors entering around the ₹400 - ₹436 range stand to benefit from a lower downside risk while targeting a substantial upside towards the ₹604 - ₹628 range.
Momentum Indicators: Moving averages and other momentum indicators, like the Relative Strength Index (RSI) and MACD, show early signs of recovery. This supports the likelihood of a potential breakout, particularly with volume confirmation.
New All-Time High (ATH) Potential: If PCBL sustains its momentum off the golden support zone, it has the potential to breach past highs and chart a new ATH.
With sound financials, a resilient technical structure, and growth-driven fundamentals, PCBL Limited presents an attractive opportunity for investors looking for a promising blend of stability and growth. Key Buying Range: ₹400 - 436 | Target Range: ₹604 - 628

SWING IDEA - PCBLNSE:PCBL is about to form a MACD Cross on the weekly charts. If the market favor this move and if it completes its crossover, the stock should easily be able to go all the way at least until its Swing High Levels.
Fundamentally speaking, the company has received a patent from the Indian Patent Office for its invention titled "hybrid carbon black grade comprising Graphene to improve performance of rubber compounds". This could further add as a factor to get this moving in the upward direction.

Darvas Box Strategy - Breakout StockDisclaimer: I am Not SEBI Registered adviser, please take advise from your financial adviser before investing in any stocks. Idea here shared is for education purpose only.
Stock has given break out. Buy above high. Keep this stock in watch list.
Buy above the High and do not forget to keep stop loss, best suitable for swing trading.
Target and Stop loss Shown on Chart. Risk to Reward Ratio/ Target Ratio 1:2.
Stop loss can be Trail when it make new box.
Be Discipline, because discipline is the key to Success in Stock Market.
Trade what you See Not what you Think.

PCBL cmp 347.This stock near all time high and giving a breakout signal on monthly timeframe. Add to wachlist and see what happen in coming days.

Breakout Stock: 21% in Short TermPCBL Ltd: Company is a part of RP‑Sanjiv Goenka Group and is in the business of production of Carbon Black and generation of electricity for the purpose of captive consumptions and sale of surplus to outsiders.
Key Points:
# Breakout
# Uptrending Stock
# Good Fundamental
# Undervalued

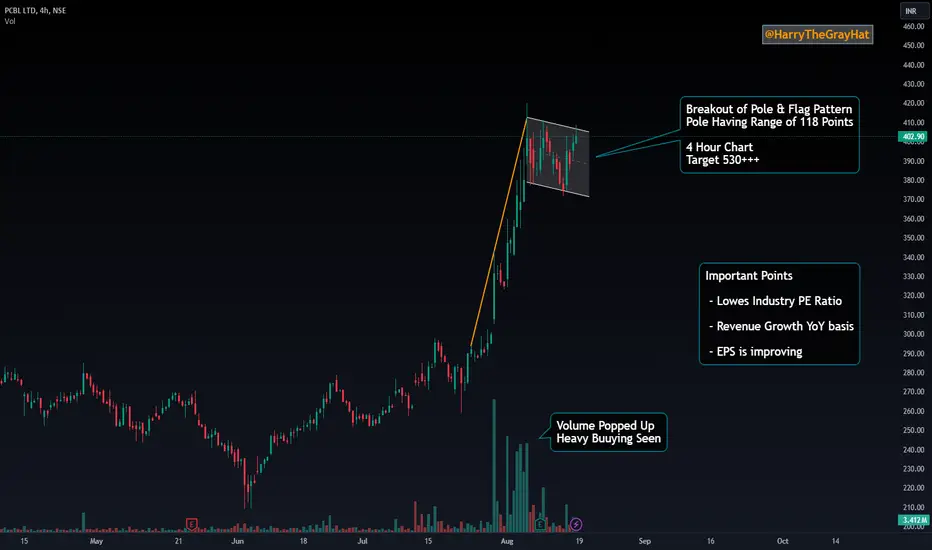
PCBL | Momentum Play| Swing | LongPrice showing momentum
Volume Dry-up
Creating a base near ATH
Caution:
Overall market conditions are highly volatile which can impact the trade idea.

pcbl#pcbl,has received a patent from the Indian Patent Office for its invention titled "hybrid carbon black grade comprising Graphene to improve performance of rubber compounds.
This invention relates to the improvement of fuel efficiency, tire durability, load bearing capacity using a hybrid filler of carbon black and graphene, vis-a-vis lowering of tire weight

PCBL-Nice BreakoutPCBL-Nice Breakout
Capital to be deployed -20k
Investing Price -350-360
Breakout Price -347
Stoploss -299
Targets -480-656
#pcbl #StockMarketindia #StockToWatch #StocksInFocus #stockstowatch #StocksToTrade

ATH breakoutGood volume build in daily time frame.
ATH breakout after price bouncing back from 50 ema.
Fundamentals looks good.
DII stakes increased compared to last year.
NOTE: I do my analysis, do yours before trade.

Cup and handle breakout Daily TFCup and handle breakout and retest.....stoploss below 271 closing basis....only for educational purpose and not any recommendation....Target 348.40


PCBL BRAKEOUT - ON DAILY CHARTNSE:PCBL
IT gives brake out on daily chart.
I am buying this stock
Near 285
And follow sl on 250
My target will be 340
My risk reward ratio is 1:1.60
Return on capital 20%


PCBLlooks good for 300++Making an upward momentum
last 3 days volume good
stop 250
target300
Company is a part of RP‑Sanjiv Goenka Group and is in the business of production of Carbon Black, speciality chemical and generation of electricity for the purpose of captive consumptions and sale of surplus to outsiders
only for education purpose!

Falling wedge on PCBLPCBL formed a falling wedge pattern on daily chart. Multiple support and resistance levels were tested during the formation of this pattern. Price brokeout of the resistance level today. However there was not a huge volume. Wait for price to break today's high. Also I could notice immediate resistance after today's high that needs to be broke to get confirmation. Stop loss can be had just below prior swing low with target just below all time high. This trade offers a good risk reward of 1:2.5.
Hope you like this idea, if you do like please boost this idea or leave a comment below on what you think. Otherwise, happy trading :-).

SWING IDEA - PBCLA potential swing trade opportunity in PCBL (Phillips Carbon Black Limited), the largest carbon black manufacturer in India.
Reasons are listed below:
Strong Support at 230-240 Zone : PCBL is rebounding from a robust support level, reflecting market confidence in the company's leading position and expertise in the carbon black industry.
'W' Pattern : A 'W' pattern observed in the daily timeframe indicates a potential reversal and bullish continuation pattern, showcasing PCBL's ability to navigate market fluctuations effectively.
Bullish Marubozu Candle : The appearance of a bullish Marubozu candle on the daily timeframe signals strong buying pressure and potential upward momentum, underscoring positive market sentiment towards PCBL's prospects.
200 EMA Support : The 200-period Exponential Moving Average (EMA) on the daily chart acts as reliable support, highlighting PCBL's consistent performance and stability in the industry.
0.5 Fibonacci Support : Finding support at the 0.5 Fibonacci level reinforces PCBL's solid fundamentals and growth potential, providing a strong foundation for potential upward movement.
Target - 300 // 333
Stoploss - Daily close below 229
DISCLAIMER -
Decisions to buy, sell, hold or trade in securities, commodities and other investments involve risk and are best made based on the advice of qualified financial professionals. Any trading in securities or other investments involves a risk of substantial losses. The practice of "Day Trading" involves particularly high risks and can cause you to lose substantial sums of money. Before undertaking any trading program, you should consult a qualified financial professional. Please consider carefully whether such trading is suitable for you in light of your financial condition and ability to bear financial risks. Under no circumstances shall we be liable for any loss or damage you or anyone else incurs as a result of any trading or investment activity that you or anyone else engages in based on any information or material you receive through TradingView or our services.
@visionary.growth.insights

PCBL (SWING) 🚀PCBL
Technically looks good
CMP :- 311
Target :- 10-15%
Support :- 284
This is not a buy/sell recommendations, do your own research and invest accordingly. Won't be liable for any of the profits and losses, I'm here to share my knowledge and expertise.
