POLICYBAZAR in Traingle PatternNSE:POLICYBZR shows a breakout of an ascending Triangle Pattern. You can make an entry at this point and target for 1950.
POLICYBZR trade ideas
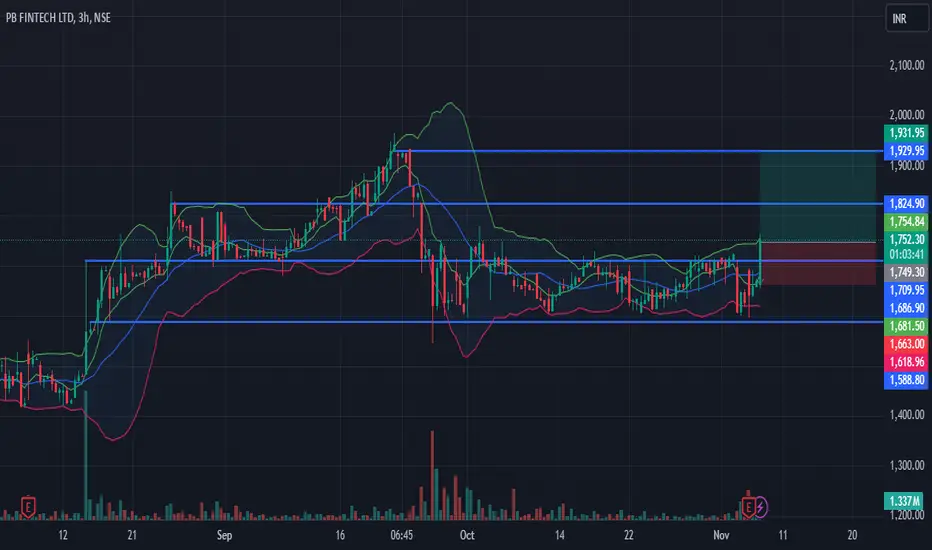
PB Fintech (NSE: 543390) Trade Setup📈 Breakout Watch | Price retesting key pivot at ₹1,745
Momentum building with RSI > 60 and bullish structure. Ideal for intraday or short swing.
🔵 Long Entry
Buy Above: ₹1,745 (Pivot breakout confirmation on 15m/1H candle close)
Target 1: ₹1,775 (minor resistance)
Target 2: ₹1,807 (next pivot)
Target 3: ₹1,869 (final swing target)
Stoploss: ₹1,720 (below previous candle low/support zone)
✅ Volume confirmation and RSI strength supporting move
🧠 Good for breakout traders looking for momentum continuation
🔴 Short Setup (if rejection from ₹1,745)
Sell Below: ₹1,730 (on rejection + bearish candle)
Target: ₹1,682
Stoploss: ₹1,745
📊 Indicators:
RSI: 65.7 → bullish, near breakout threshold
BB% B: 0.88 → strong bullish move near upper band

PB FINTECH LTD CLOSING ABOVE RESISTANCE WILL ACTIVE SWING TRADE📊 Price Action & Trend Analysis
Analyzing market trends using price action, key support/resistance levels, and candlestick patterns to identify high-probability trade setups.
Always follow the trend and manage risk wisely!
Price Action Analysis Interprets Market Movements Using Patterns And Trends On Price Charts.
👉👉👉Follow us for Live Market Views/Trades/Analysis/News Updates.

Review and plan for 18th February 2025Nifty future and banknifty future analysis and intraday plan.
Few interesting charts.
This video is for information/education purpose only. you are 100% responsible for any actions you take by reading/viewing this post.
please consult your financial advisor before taking any action.
----Vinaykumar hiremath, CMT

BUY PB FINTECH LTDPOLICYBZR one of fintech company looks good at the current price. investors can make position in this stock with buying level of 1750-1800 with TARGET of 2000, 2200 AND put STOPLOSS at 1600rs.


PB Fintech Ltd view for Intraday 5th Dec #POLICYBZR PB Fintech Ltd view for Intraday 5th Dec #POLICYBZR
Resistance 2020. Watching above 2025 for upside movement...
Support area 1970 Below 1990 ignoring upside momentum for intraday
Support 1970 Watching below 1965 for downside movement...
Resistance area 2020
Above 1990 ignoring downside move for intraday
Charts for Educational purposes only.
Please follow strict stop loss and risk reward if you follow the level.
Thanks,
V Trade Point

POLICYBZR CMP 1750On Three Hour timeframe stock consolidating from long time Today i giving a breakout signal.For swing trading we can find a 1:2 Risk Reward setup.And after 1800 it will be rocket .Add to your wachlist and take a analysis in its chart before trade. Thank You.
POLICYBAZAAR (POLICYBZR) Trade UpdateTrade Overview: A strong bullish momentum is evident, with TP1 already achieved at 1709.20. The remaining targets are well within reach, given the current trend.
Key Levels:
Entry: 1677.05
Stop Loss (SL): 1651.05
Take Profit Targets:
TP2: 1761.20
TP3: 1813.20
TP4: 1845.30
Technical Insight: The price is holding above the critical support levels, with the GREEN trend line from the Risological Indicator signaling continued upward movement. Traders are advised to trail the stop loss to lock in profits as the trade progresses.
Keep monitoring for trend continuity!

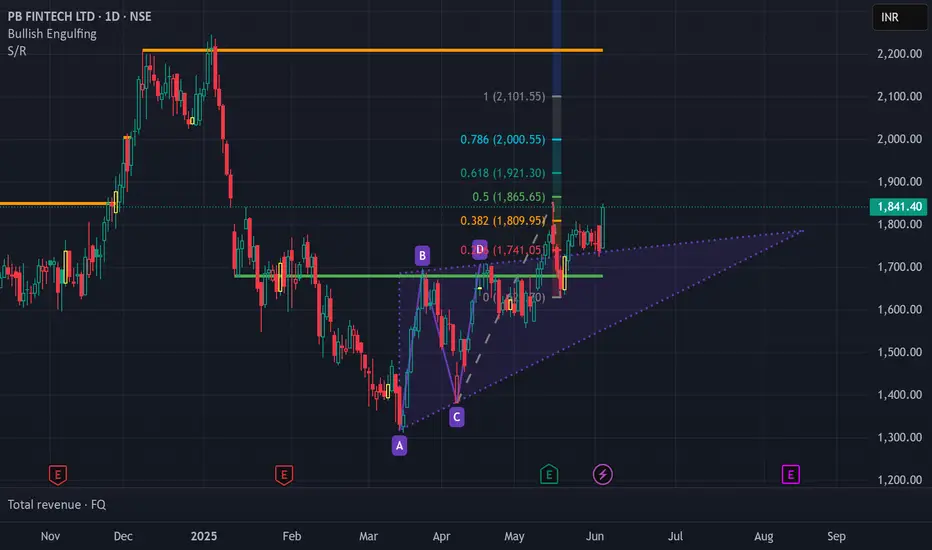
PB FINTECH LTD S/R Support and Resistance Levels:
Support Levels: These are price points (green line/shade) where a downward trend may be halted due to a concentration of buying interest. Imagine them as a safety net where buyers step in, preventing further decline.
Resistance Levels: Conversely, resistance levels (red line/shade) are where upward trends might stall due to increased selling interest. They act like a ceiling where sellers come in to push prices down.
Breakouts:
Bullish Breakout: When the price moves above resistance, it often indicates strong buying interest and the potential for a continued uptrend. Traders may view this as a signal to buy or hold.
Bearish Breakout: When the price falls below support, it can signal strong selling interest and the potential for a continued downtrend. Traders might see this as a cue to sell or avoid buying.
20 EMA (Exponential Moving Average):
Above 20 EMA(50 EMA): If the stock price is above the 20 EMA, it suggests a potential uptrend or bullish momentum.
Below 20 EMA: If the stock price is below the 20 EMA, it indicates a potential downtrend or bearish momentum.
Trendline: A trendline is a straight line drawn on a chart to represent the general direction of a data point set.
Uptrend Line: Drawn by connecting the lows in an upward trend. Indicates that the price is moving higher over time. Acts as a support level, where prices tend to bounce upward.
Downtrend Line: Drawn by connecting the highs in a downward trend. Indicates that the price is moving lower over time. It acts as a resistance level, where prices tend to drop.
RSI: RSI readings greater than the 70 level are overbought territory, and RSI readings lower than the 30 level are considered oversold territory.
Combining RSI with Support and Resistance:
Support Level: This is a price level where a stock tends to find buying interest, preventing it from falling further. If RSI is showing an oversold condition (below 30) and the price is near or at a strong support level, it could be a good buy signal.
Resistance Level: This is a price level where a stock tends to find selling interest, preventing it from rising further. If RSI is showing an overbought condition (above 70) and the price is near or at a strong resistance level, it could be a signal to sell or short the asset.
Disclaimer:
I am not a SEBI registered. The information provided here is for learning purposes only and should not be interpreted as financial advice. Consider the broader market context and consult with a qualified financial advisor before making investment decisions.

POLICYBZR Swing Long SetupEnter with Stop Limit order placed at - 1740
Target with Risk to reward 1:2 is 2130
Stoploss only when 1 day candle closes below the price - 1545.05
Note: This is not any financial advice, this is for education purpose only.

PB FINTECH Ltd view for Intraday 30th September #POLICYBZR PB FINTECH Ltd view for Intraday 30th September #POLICYBZR
Buying may witness above 1665
Support area 1640. Below ignoring buying momentum for intraday
Selling may witness below 1619
Resistance area 1640
Above ignoring selling momentum for intraday
Charts for Educational purposes only.
Please follow strict stop loss and risk reward if you follow the level.
Thanks,
V Trade Point

Take a look at PB Fintech Policy bazar is at ATH
Trying for breakout
buy above 1400
Target 1600 (approx. 14% )
SL 3% or look at chart
Keep watch on Market
This is only for educational purpose

PB Fintech - P1- BreakoutPB Fintech: CMP: 1331.60 ; RSI 75.23
PB Fintech, the parent company of Policy Bazaar and Paisa Bazaar, witnessed its shares surpass the IPO price apiece after two years as investors responded positively to the company's robust performance in Q3FY24. As company become profitable and now net positive on books, soon it will surpose its All time high of Rs: 1470.
Short Term Taregt : 1557; Stop Loss 1: 1255
Mid Term traget: 1880 ; LongTerm target: 2404

Policy Bazaar chart analysisPolicy Bazaar chart analysis on daily time frame. It looks like that its a breakout and retest.
Please share your valuable feedback.

PB FINTECHThis stock is showing strength after great listing it goes down now it is in All time high zone. the first target will its all time high.
as the stock already running dont buy in one go. buy half qty first if come down average down price but always follow sl.
SL 955
it has gud potential for upside . Follow strict SL & Proper RISK REWARD RATIO. This is the only holy grail in the market.

Ready to break 3 years old Round Bottom breakoutPolicybazaar is getting ready to break 3 years old Round Bottom breakout with good volume.
Safe entry above =1400
Risky entry at =1370
Support zone =1300
Targets are = 1500,1600,1650
KEEP IN RADAR

PB FINTECH READY FOR UPSIDE MOVE TARGET 2400Here's a message you could use to share your idea on TradingView:
Title: PB Fintech Potential: Target 2400 in 6 Months
Description:
I'm eyeing PB Fintech (CMP: 1300) for a potential uptrend, aiming for a target price of 2400 within a 6-month timeframe. With its strong fundamentals and market dynamics, PB Fintech presents an enticing opportunity for growth-oriented investors. Keep an eye on key indicators and news developments to gauge the progress towards this target.
Please note that this is not financial advice, and trading decisions should be made based on your own research and risk assessment. Share your thoughts and analysis on this potential trade!

POLICYBZR | KEEP ON RADAR POLICYBZR looks good as per the setup.
CMP:- 1085
SHORT-TERM TGT :- 1231/1470 ++
MID-LONG TGT:- 1470/2158/2606 ++
SL:-885
Disclaimer: I am not a SEBI registered analyst. All the stocks are for educational purposes. Investors must consult a financial advisor before making any investment. It is not a buy or sell recommendation.

PBFintech - Mapping a script using Pivots, CPR and MoneyFlow Hey Pivster's
Here, I have tried to demonstrate how you can use the money flow in the market to map the script alongside its basic price action which eventually leads us to some interesting zones in the journey which are being classified as the 'buyers' or 'sellers' zone depending upon the situation of the price and money flow statistics present at that very juncture!
Moreover, due to limited time we quickly dived in to see the confluence of these zones (current stop) along with Pivot Points of multiple timeframes in a single tab which give us an additional boost to our analysis and make the trade refined apart from the standard information available in the market.
NSE:POLICYBZR (MTF PIVOT CHART) -
NSE:POLICYBZR (CPR TRAILS CHART) -
NSE:POLICYBZR ( DAILY TF CHART ) -
Thank You!

Today's learning on Resistant become supportWe are seeing that price is going up and price has break a certain range with full volume .
What we are expecting that price has to come to retest and give some conformation then we can have a trade.
That's we all have learn today....... Resitant become Support

Policy Bazar looking good for a smart up-move. PB Fintech Ltd. is an integrated online marketing and consulting Company and is in the business of rendering online marketing and information technology consulting/support services largely for the financial service industry, including insurance. PB Fintech Ltd CMP is 933.60.
The Negative aspects of the company are Extremely High Valuation and FIIs decreasing stake. The company's Positive aspects are No debt, MFs are increasing stake, improving annual net profit, Improving cash from operations annual.
Entry can be taken after closing above 942. Targets in the stock will be 958 and 986. The long-term target in the stock will be 1007 and 1029. Stop loss in the stock should be maintained at Closing below 889.
The above information is provided for educational purpose, analysis and paper trading only. Please don't treat this as a buy or sell recommendation for the stock. We do not guarantee any success in highly volatile market or otherwise. Stock market investment is subject to market risks which include global and regional risks. We will not be responsible for any Profit or loss that may occur due to any financial decision taken based on any data provided in this message.
