LOOKS BULLISHMoving Averages (Simple & Exponential): All signals (from 5‑day to 200‑day) in both SMA & EMA suggest strong BUY .
Trend Oscillators:
MACD: Bullish with positive value ~134 .
ADX/DMI: ADX ~23 indicates weak trend, but DMI+ (32.8) > DMI– (14.8), signalling a bullish bias .
Momentum Oscillators:
RSI (~75), Stochastic K/D (~85/71), and Stochastic RSI K/D (~100/81) all in overbought territory.
CCI (~195), PSAR (~14,150) and Momentum (~4,343) are bullish.
However, True Range (~1,071) and ATR (~647) show heightened volatility—coded as SELL signals Technical Summary (May): ~83% of indicators were BUY signals, with 7% SELL, and 10% NEUTRAL
POWERINDIA trade ideas

HITACHI ENERGY INDIA LTD S/RSupport and Resistance Levels:
Support Levels: These are price points (green line/shade) where a downward trend may be halted due to a concentration of buying interest. Imagine them as a safety net where buyers step in, preventing further decline.
Resistance Levels: Conversely, resistance levels (red line/shade) are where upward trends might stall due to increased selling interest. They act like a ceiling where sellers come in to push prices down.
Breakouts:
Bullish Breakout: When the price moves above resistance, it often indicates strong buying interest and the potential for a continued uptrend. Traders may view this as a signal to buy or hold.
Bearish Breakout: When the price falls below support, it can signal strong selling interest and the potential for a continued downtrend. Traders might see this as a cue to sell or avoid buying.
MA Ribbon (EMA 20, EMA 50, EMA 100, EMA 200) :
Above EMA: If the stock price is above the EMA, it suggests a potential uptrend or bullish momentum.
Below EMA: If the stock price is below the EMA, it indicates a potential downtrend or bearish momentum.
Trendline: A trendline is a straight line drawn on a chart to represent the general direction of a data point set.
Uptrend Line: Drawn by connecting the lows in an upward trend. Indicates that the price is moving higher over time. Acts as a support level, where prices tend to bounce upward.
Downtrend Line: Drawn by connecting the highs in a downward trend. Indicates that the price is moving lower over time. It acts as a resistance level, where prices tend to drop.
Disclaimer:
I am not a SEBI registered. The information provided here is for learning purposes only and should not be interpreted as financial advice. Consider the broader market context and consult with a qualified financial advisor before making investment decisions.

Hitachi Energy India Ltd. (PowerIndia) AnalysisCMP 12033.50 | SL 11040 |TP 13580
Potential upside 12.58%
R/R 1.56
Disclaimer: DYOR

HITACHI ENERGY S/R Support and Resistance Levels:
Support Levels: These are price points (green line/shade) where a downward trend may be halted due to a concentration of buying interest. Imagine them as a safety net where buyers step in, preventing further decline.
Resistance Levels: Conversely, resistance levels (red line/shade) are where upward trends might stall due to increased selling interest. They act like a ceiling where sellers come in to push prices down.
Breakouts:
Bullish Breakout: When the price moves above resistance, it often indicates strong buying interest and the potential for a continued uptrend. Traders may view this as a signal to buy or hold.
Bearish Breakout: When the price falls below support, it can signal strong selling interest and the potential for a continued downtrend. Traders might see this as a cue to sell or avoid buying.
20 EMA (Exponential Moving Average):
Above 20 EMA(50 EMA): If the stock price is above the 20 EMA, it suggests a potential uptrend or bullish momentum.
Below 20 EMA: If the stock price is below the 20 EMA, it indicates a potential downtrend or bearish momentum.
Trendline: A trendline is a straight line drawn on a chart to represent the general direction of a data point set.
Uptrend Line: Drawn by connecting the lows in an upward trend. Indicates that the price is moving higher over time. Acts as a support level, where prices tend to bounce upward.
Downtrend Line: Drawn by connecting the highs in a downward trend. Indicates that the price is moving lower over time. It acts as a resistance level, where prices tend to drop.
RSI: RSI readings greater than the 70 level are overbought territory, and RSI readings lower than the 30 level are considered oversold territory.
Combining RSI with Support and Resistance:
Support Level: This is a price level where a stock tends to find buying interest, preventing it from falling further. If RSI is showing an oversold condition (below 30) and the price is near or at a strong support level, it could be a good buy signal.
Resistance Level: This is a price level where a stock tends to find selling interest, preventing it from rising further. If RSI is showing an overbought condition (above 70) and the price is near or at a strong resistance level, it could be a signal to sell or short the asset.
Disclaimer:
I am not a SEBI registered. The information provided here is for learning purposes only and should not be interpreted as financial advice. Consider the broader market context and consult with a qualified financial advisor before making investment decisions.

Hitachi EnergyStock Resumed its uptrend from 23-July-2024.
can accumulate in dips up to 11730 levels
Short Term Targets
First Target - 13400
second Target - 14400
Stop loss - 10895
Long term investors can buy in every dip and wait for the targets of 15600 and 20000
This idea is for education purpose and cannot be used for real time investment.. kindly consult your financial adviser before investing

Opportunity of SWING TRADE in POWERINDIAPOWERINDIA is near its monthly support. it could take support and we could see reversal from there and target would be 13500 to its weekly resistance. as we know there is a movement in power sector so it could support this trade.

[HP] Hitachi Energy Short IdeaStock is trading at 39.4 times its book value. Company has a low return on equity of 12.7% over last 3 years. Where ABB is 20% over last 3 years and that one is trading 30 times! So this is due to it being not in FNO and susceptible to manipulation!
Note -
One of the best forms of Price Action is to not try to predict at all. Instead of that, ACT on the price. So, this chart tells at "where" to act in "what direction. Unless it triggers, like, let's say the candle doesn't break the level which says "Buy if it breaks", You should not buy at all.
=======
I use shorthands for my trades.
"Positional" - means You can carry these positions and I do not see sharp volatility ahead. (I tally upcoming events and many small kinds of stuff to my own tiny capacity.)
"Intraday" -means You must close this position at any cost by the end of the day.
"Theta" , "Bounce" , "3BB" or "Entropy" - My own systems.
=======
I won't personally follow any rules. If I "think" (It is never gut feel. It is always some reason.) the trade is wrong, I may take reverse trade. I may carry forward an intraday position. What is meant here - You shouldn't follow me because I may miss updating. You should follow the system I share.
=======
Like -
Always follow a stop loss.
In the case of Intraday trades, it is mostly the "Day's High".
In the case of Positional trades, it is mostly the previous swings.
I do not use Stop Loss most of the time. But I manage my risk with options as I do most of the trades using derivatives


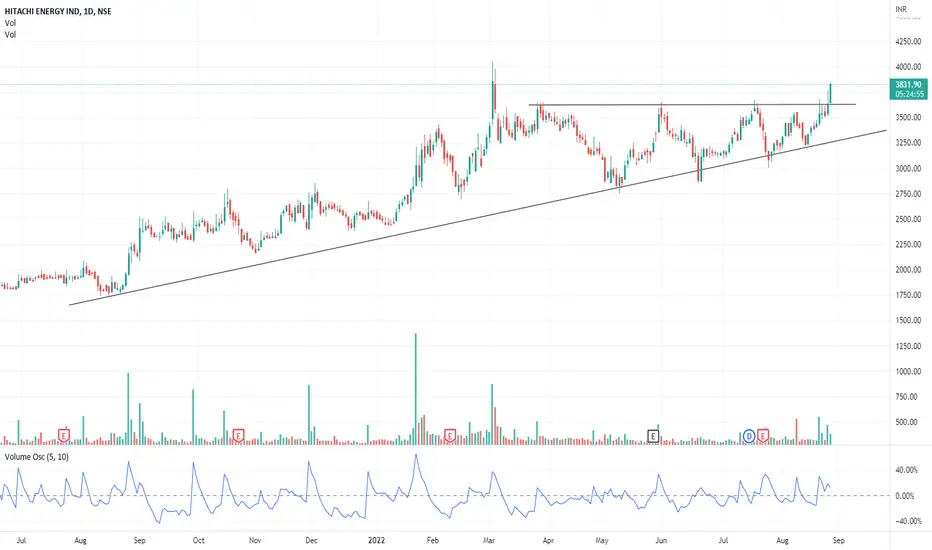
Hitachi Energy-Nice breakoutHitachi Energy-Nice breakout.
Capital to be deployed- 20k
Investing Price -4250-4270
Breakout Price -4234
Stoploss-3790
Targets-5568-6011
#hitachi #StocksToBuy #StockMarket #StockToWatch #StocksInFocus #stockstowatch


POWERINDIA POWERINDIA - Confluence of weekly channel support and demand zone.
The stock has a high scalable business and good fundamentals.
One can add with a SL of today's low.

STOCK ANALYSIS POWER INDIA LTD FOR ONE MONTHgood evening friends stock is forming M pattern and can show donwward journey if not sustain above 3430 that ath level.
See video for detailed analysis.

powerindia potencial 10 to 20 %see chart for technical
result is coming and chart is giving bullish pattern
may be if breakout happens then it can give 10 to 20 %
happy trading ,
Samkit Jain

Hitachi India BreakoutThe stock has broken out and retested, therefore may undergo a reversal rally. Trade is supported by brokerage calls and Supports Nearby.
Risk Reward Ratio - 3:1
SL is placed below support zone & the lower trendline. The target is placed near resistance.

POWER INDIA POWER INDIA - High strength structure
Look at the following points -
1. Shakeout at all time high to remove the weak longs.
2. Retest of the previous breakout structure
3. Fresh all time closing.
This strong stood strong during a correction. The odds of out performance are high here.

POWER INDIA ENTRY SETUP 1:3🎯🔥NSE:POWERINDIA Broke out of an ascending channel pattern. Price gave excellent momentum during breakout but it witnessed heavy selling pressure during market hours.
As a result, price left huge wick behind. Script should consolidate for some days before the next momentum candle because of the huge rejection at higher levels. Track closely.
Consider entering 20-30% position at C.M.P if price opens gap up. To play even safer, enter with full position after retrace and confirmation.
Targets: 3500/4000/4200+
sl below the channel (below 2580)
Position size according to entry price. HAPPY TRADING!

power india.....................................................power india........................................

POWERINDIABeautiful Price Action. Looking good for Long. Will be Low risk entry if it does give retest at breakout level of 2520.
Target : 3025
For education purpose only...


POWERINDIA rising channel pattern.Beautiful rising channel pattern. Good buying opportunity now for 2000 levels and with volume my give a further breakout and new heights. Stoploss below the channel treadline breakdown.
PS: Do your own analysis before trading :)

PowerIndiaVolatility and volume contraction visible in the last few days. Expecting the stock to burst out of the range soon.
