Reliance Industries Bullish Flag BreakoutReliance Industries Ltd has confirmed a bullish flag pattern breakout, indicating strong upward momentum. The target for this breakout is set at 3340, with key support at 3095. The breakout is supported by high volume, suggesting strong buying interest. This setup presents a promising opportunity for traders looking to capitalize on further upside potential. 📈
RELIANCE trade ideas

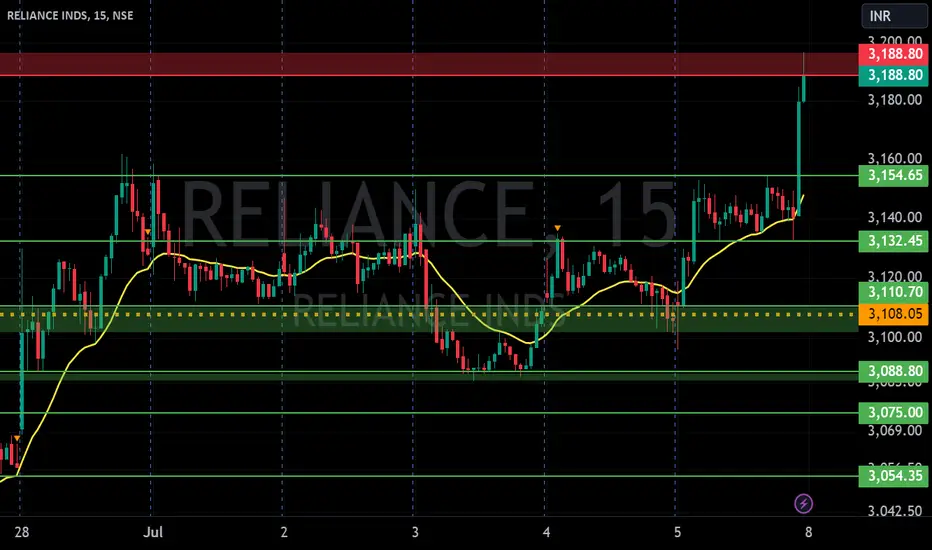
RIL S/R for 8/7/24Support and Resistance Levels: In technical analysis, support and resistance levels are significant price levels where buying or selling interest tends to be strong. They are identified based on previous price levels where the price has shown a tendency to reverse or find support.
Support levels are represented by the green line and green shade, indicating areas where buying interest may emerge to prevent further price decline.
Resistance levels are represented by the red line and red shade, indicating areas where selling pressure may arise to prevent further price increases. Traders often consider these levels as potential buying or selling opportunities.
Breakouts: Breakouts occur when the price convincingly moves above a resistance level (red shade) or below a support level (green shade). A bullish breakout above resistance suggests the potential for further price increases, while a bearish breakout below support suggests the potential for further price declines. Traders pay attention to these breakout signals as they may indicate the start of a new trend or significant price movement.
20 EMA: The yellow line denotes 20 EMA, to interpret the 20 EMA, you need to compare it with the prevailing stock price. If the stock price is below the 20 EMA, it signals a possible downtrend. But if the stock price is above the 20 EMA, it signals a possible uptrend.
Disclosure: I am not SEBI registered. The information provided here is for learning purposes only and should not be interpreted as financial advice. It is important to consult with a qualified financial advisor before making any investment decisions. Tweets neither advice nor endorsement.
RIL S/R for 4/7/24Support and Resistance Levels: In technical analysis, support and resistance levels are significant price levels where buying or selling interest tends to be strong. They are identified based on previous price levels where the price has shown a tendency to reverse or find support.
Support levels are represented by the green line and green shade, indicating areas where buying interest may emerge to prevent further price decline.
Resistance levels are represented by the red line and red shade, indicating areas where selling pressure may arise to prevent further price increases. Traders often consider these levels as potential buying or selling opportunities.
Breakouts: Breakouts occur when the price convincingly moves above a resistance level (red shade) or below a support level (green shade). A bullish breakout above resistance suggests the potential for further price increases, while a bearish breakout below support suggests the potential for further price declines. Traders pay attention to these breakout signals as they may indicate the start of a new trend or significant price movement.
20 EMA: The yellow line denotes 20 EMA, to interpret the 20 EMA, you need to compare it with the prevailing stock price. If the stock price is below the 20 EMA, it signals a possible downtrend. But if the stock price is above the 20 EMA, it signals a possible uptrend.
Disclosure: I am not SEBI registered. The information provided here is for learning purposes only and should not be interpreted as financial advice. It is important to consult with a qualified financial advisor before making any investment decisions. Tweets neither advice nor endorsement.

Reliance Industries: Could be great momentum trade!!Reliance recently raised its mobile tariff. So the stock is in news.
Stock was trading in a range (rectangle pattern, darvas box, accumulation stage.
After the announcement of the tariff hike by the company, its stock price broke out from the range.
This breakout could be the continuation of the uptrend of the stock, and in coming days we have see further rise in the stock price of reliance.
Pattern gets invalidated if it breaks down from the range.

RELIANCEReliance has decisively broken the all-time high. I am currently waiting for a retest to enter the long trade.

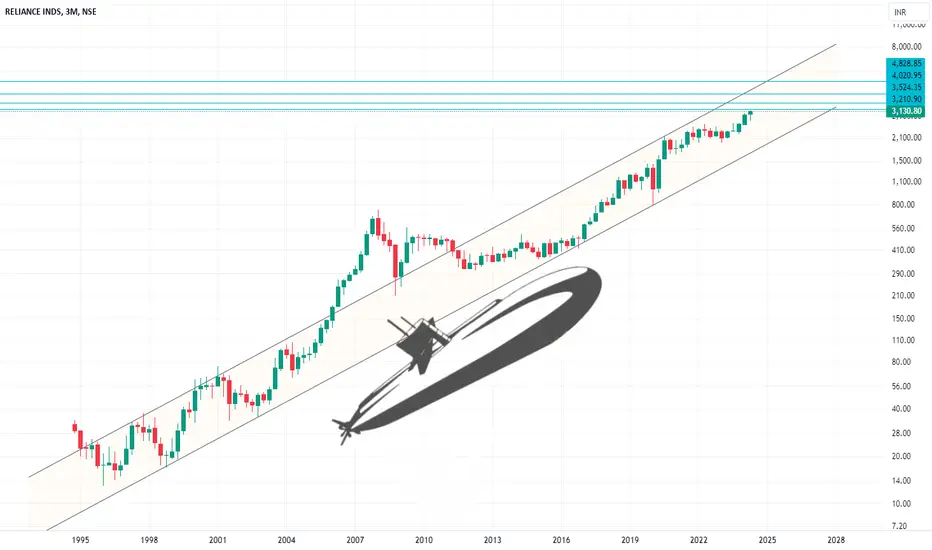
ALERT - Indigenously developed Nuclear Submarine heading NEindigenously developed Nuclear Submarine " Pattern " - by Reliance Industries - is Heading NE
Targets Locked and Loaded
1st Target - 32* N, 10*E (Rs. 3,210)
2nd Target - 35*N, 25*E (Rs. 3,525)
3rd Target - 40*N, 20*E (Rs. 4,020)
4rd Target - 48*N, 28*E (Rs. 4,828)
Sorry folks - When I saw this pattern - I couldn't just control myself and came up with this Prank 🤣😆😄🤩
Anyways, Reliance Industries has broken out of a Box Pattern and is ready for a Blast
RIL S/R for 1/7/24Support and Resistance Levels: In technical analysis, support and resistance levels are significant price levels where buying or selling interest tends to be strong. They are identified based on previous price levels where the price has shown a tendency to reverse or find support.
Support levels are represented by the green line and green shade, indicating areas where buying interest may emerge to prevent further price decline.
Resistance levels are represented by the red line and red shade, indicating areas where selling pressure may arise to prevent further price increases. Traders often consider these levels as potential buying or selling opportunities.
Breakouts: Breakouts occur when the price convincingly moves above a resistance level (red shade) or below a support level (green shade). A bullish breakout above resistance suggests the potential for further price increases, while a bearish breakout below support suggests the potential for further price declines. Traders pay attention to these breakout signals as they may indicate the start of a new trend or significant price movement.
20 EMA: The yellow line denotes 20 EMA, to interpret the 20 EMA, you need to compare it with the prevailing stock price. If the stock price is below the 20 EMA, it signals a possible downtrend. But if the stock price is above the 20 EMA, it signals a possible uptrend.
Disclosure: I am not SEBI registered. The information provided here is for learning purposes only and should not be interpreted as financial advice. It is important to consult with a qualified financial advisor before making any investment decisions. Tweets neither advice nor endorsement.

Reliance Industries: Bullish Momentum with Strong ProbabilitiesAnalysis:
The chart shows Reliance Industries (NSE: RELIANCE) with a significant bullish momentum. Here are the key observations:
Current Price: 3,104.25 INR, showing an increase of 60.30 (+1.98%).
Stochastic based indicator: Shows a bullish signal with recent buy indications.
Volume: The volume has been steadily increasing, supporting the bullish sentiment.
Technical Indicators:
EMA (Exponential Moving Averages): The price is above key EMA lines (21, 50, 100), reinforcing the bullish trend.
Heikin Ashi Candles: The recent green Heikin Ashi candles suggest strong upward momentum.
Support and Resistance Levels:
Immediate Support: 2,980.26 INR (as indicated by EMA and recent lows).
Immediate Resistance: 3,130.80 INR (recent highs).
Conclusion:
Given the strong bullish indicators and supportive volume, Reliance Industries is likely to continue its upward trajectory in the near term. Traders may consider this as a potential buying opportunity.
Disclaimer:
This analysis is for informational purposes only and should not be considered as investment advice. Always do your own research before making any trading decisions.


RIL S/R for 29/6/24Support and Resistance Levels: In technical analysis, support and resistance levels are significant price levels where buying or selling interest tends to be strong. They are identified based on previous price levels where the price has shown a tendency to reverse or find support.
Support levels are represented by the green line and green shade, indicating areas where buying interest may emerge to prevent further price decline.
Resistance levels are represented by the red line and red shade, indicating areas where selling pressure may arise to prevent further price increases. Traders often consider these levels as potential buying or selling opportunities.
Breakouts: Breakouts occur when the price convincingly moves above a resistance level (red shade) or below a support level (green shade). A bullish breakout above resistance suggests the potential for further price increases, while a bearish breakout below support suggests the potential for further price declines. Traders pay attention to these breakout signals as they may indicate the start of a new trend or significant price movement.
Disclosure: I am not SEBI registered. The information provided here is for learning purposes only and should not be interpreted as financial advice. It is important to consult with a qualified financial advisor before making any investment decisions. Tweets neither advice nor endorsement.

Reliance will fall hereonReliance industries is around the Long term Resistance
Right now on a Daily timeframe, Stock is making Broadning pattern
If Stock follows the pattern then we can see downside of 10-13% from these levels
Disclaimer :- This is POSSIBLE BROADENING Pattern
Thank You !!
Disclaimer : We are not SEBI registered analyst. Do your own research before taking any investment decision.

RELIANCE 1weeklet's see what happens
I Am Not SEBI Registered Analyst. All Post and Levels Posting is only for educational and knowledge purpose. I Am not responsible for your any kind of loss or profit.
No Claim, All Rights Reserved.‼️

RELIANCE INDUSTRIES Breakout happend in this stock with rising 200dma.
Keep your risk and reward ratios according to your preferance.

reliance chart analysisreliance chart analysis on daily timeframe. Please give your valuable feedback.

RELIANCE Strong Weekly ClosingReliance is gonna close strong this week and move north. It might push Nifty till 25000

RELIANCE NEW ALL TIME HIGH INCOMING??Breakout details are in the chart with potential upside and bull view invalidation

RIL S/R for 26/6/24Support and Resistance Levels: In technical analysis, support and resistance levels are significant price levels where buying or selling interest tends to be strong. They are identified based on previous price levels where the price has shown a tendency to reverse or find support.
Support levels are represented by the green line and green shade, indicating areas where buying interest may emerge to prevent further price decline.
Resistance levels are represented by the red line and red shade, indicating areas where selling pressure may arise to prevent further price increases. Traders often consider these levels as potential buying or selling opportunities.
Breakouts: Breakouts occur when the price convincingly moves above a resistance level (red shade) or below a support level (green shade). A bullish breakout above resistance suggests the potential for further price increases, while a bearish breakout below support suggests the potential for further price declines. Traders pay attention to these breakout signals as they may indicate the start of a new trend or significant price movement.
Disclosure: I am not SEBI registered. The information provided here is for learning purposes only and should not be interpreted as financial advice. It is important to consult with a qualified financial advisor before making any investment decisions. Tweets neither advice nor endorsement.
Reliance Juicy SellReliance looks really juicy to sell. The last rejection was very nice and seems to be accumulating positions towards sell. if it breaks recent high, look towards closing position in loss.

Reliance Intraday Levels: 25-Jun-24Reliance close at support of horizontal & Trendline with W formation below levels are important for trend determination
Bullish > 2900
Bearish< 2870

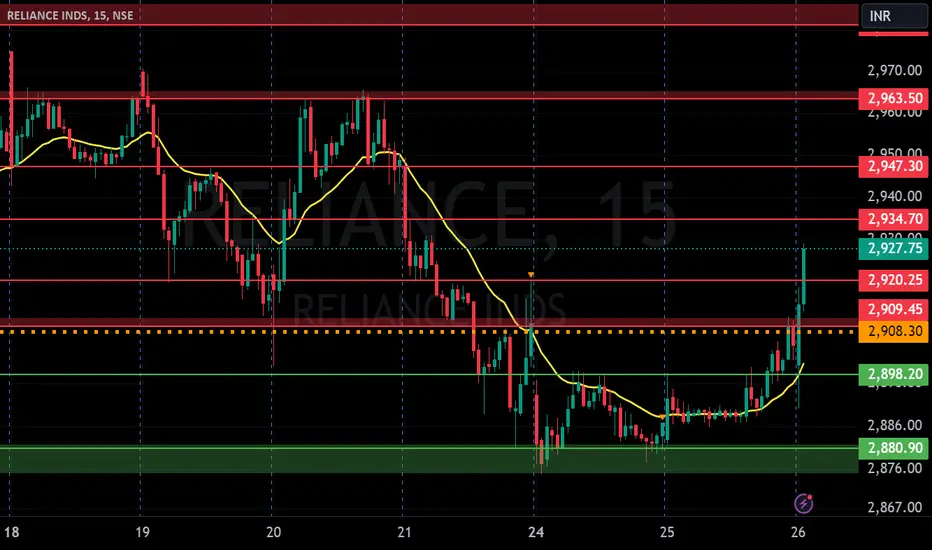
RIL S/R for 25/6/24Support and Resistance Levels: In technical analysis, support and resistance levels are significant price levels where buying or selling interest tends to be strong. They are identified based on previous price levels where the price has shown a tendency to reverse or find support.
Support levels are represented by the green line and green shade, indicating areas where buying interest may emerge to prevent further price decline.
Resistance levels are represented by the red line and red shade, indicating areas where selling pressure may arise to prevent further price increases. Traders often consider these levels as potential buying or selling opportunities.
Breakouts: Breakouts occur when the price convincingly moves above a resistance level (red shade) or below a support level (green shade). A bullish breakout above resistance suggests the potential for further price increases, while a bearish breakout below support suggests the potential for further price declines. Traders pay attention to these breakout signals as they may indicate the start of a new trend or significant price movement.
Disclosure: I am not SEBI registered. The information provided here is for learning purposes only and should not be interpreted as financial advice. It is important to consult with a qualified financial advisor before making any investment decisions. Tweets neither advice nor endorsement.

RIL S/R for 24/6/24Support and Resistance Levels: In technical analysis, support and resistance levels are significant price levels where buying or selling interest tends to be strong. They are identified based on previous price levels where the price has shown a tendency to reverse or find support.
Support levels are represented by the green line and green shade, indicating areas where buying interest may emerge to prevent further price decline.
Resistance levels are represented by the red line and red shade, indicating areas where selling pressure may arise to prevent further price increases. Traders often consider these levels as potential buying or selling opportunities.
Breakouts: Breakouts occur when the price convincingly moves above a resistance level (red shade) or below a support level (green shade). A bullish breakout above resistance suggests the potential for further price increases, while a bearish breakout below support suggests the potential for further price declines. Traders pay attention to these breakout signals as they may indicate the start of a new trend or significant price movement.
Disclosure: I am not SEBI registered. The information provided here is for learning purposes only and should not be interpreted as financial advice. It is important to consult with a qualified financial advisor before making any investment decisions. Tweets neither advice nor endorsement.

Reliance industries Reliance industries support and resistance levels.
R1 : 2971.85
R2 : 2987.20
R3 : 3016.50
S1 : 2926.15
S2 : 2898.05
S3 : 2881.00

Request for Tradingview for feature expansion.I do not understand why specific country search is not available in the "All" category search.
Someone based in Japan may be interested in trading only Japanese securities and may not want to search for any other symbols. But every time he searches, he will see other irrelevant securities.
I request TradingView to add a country search to the "All" category as well.
Sorry I do not understand how my drawings shifted wrongly in my charts.
But I hope you guys understand what I want to show you.
