Reliance industries.. 3500Rs Upcoming levl of reliance 🚀 with the shift of big money from small and mid🧐 to large cap..on the fib retracement levls
RELIANCE trade ideas

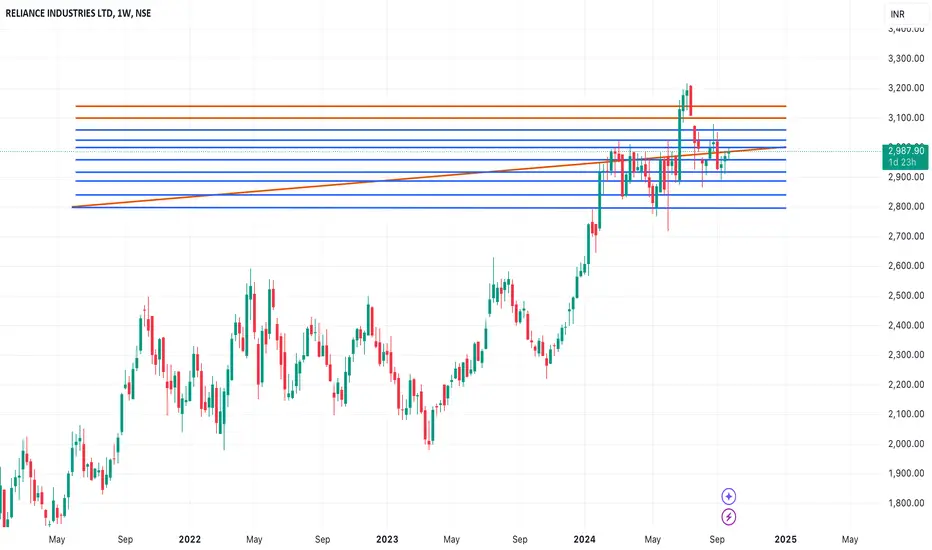
RELIANCE CMP 345. For swing.after making a latest high around 3200.stock was in consolidation and making a resistance around 3000 levels . now at hourly timeframe making a strong candle with volume. we can see a swing trade in this .

Reliance Industries Ltd. (RIL) Technical Analysis OverviewAs of September 26, 2024 , the daily chart of Reliance Industries (RIL) is presenting a cup and handle pattern , a bullish continuation structure suggesting potential upward movement in the stock price.
Key Insights:
Cup and Handle Formation:
The stock has completed the cup portion and is forming the handle, indicating a likely breakout.
A breakout from the handle typically signals a bullish move.
Breakout Levels:
The price is currently trading near ₹2,995 , nearing an important breakout level of ₹3,020.
A
breakout above ₹3,074 could trigger further upward momentum.
Targets:
Target 1 : The first potential target stands at ₹3,074 with a price move projection of 120 points (4.04%).
Target 2 : If momentum continues, a second target is projected at ₹3,205, with a price move of 233 points (7.86%).
Volume Profile Analysis:
The volume bars show significant interest between ₹2,920 to ₹3,020, indicating strong accumulation in this range.
Above ₹3,074, volume support could drive the price higher, especially if the breakout is accompanied by increased buying volume.
Moving Averages:
The stock is trading above the 50-day and 100-day moving averages, which are providing good support and indicating bullish momentum in the medium term.
MACD:
The MACD line is about to cross above the signal line, signaling a potential buy opportunity with positive momentum.
A strong bullish divergence between price and MACD suggests that momentum is picking up for an upward move.
Conclusion:
The chart of Reliance Industries is setting up for a possible bullish breakout, supported by technical indicators such as the cup and handle pattern, volume accumulation, and MACD crossover. Traders should watch for a sustained breakout above ₹3,074 to confirm the upward move, with targets of ₹3,205 and potentially higher in the medium term.

Reliance Industries Bullish reliance industries is looking bullish and it can go upto 3200 levels in short term , crucial levels for the upside are 3020 and 3070 once we see it crosses these levels there is unprecedented upside on the charts , view remains null and void if reliance industries breaches 2860 on the downside till then it is buy on dips.
Reliance up or down?What is the next movement direction of Reliance after the head and shoulders pattern?

Reliance Intraday Levels: 23-Sep-24 Reliance closed near support Zone , wait for proper rejection or Breakout at zone for entry.
Bullish > 2980
Bearish < 2960
Use SL trailing method to secure profit

RIL S/R for 23/9/24Support and Resistance Levels:
Support Levels: These are price points (green line/shade) where a downward trend may be halted due to a concentration of buying interest. Imagine them as a safety net where buyers step in, preventing further decline.
Resistance Levels: Conversely, resistance levels (red line/shade) are where upward trends might stall due to increased selling interest. They act like a ceiling where sellers come in to push prices down.
Breakouts:
Bullish Breakout: When the price moves above resistance, it often indicates strong buying interest and the potential for a continued uptrend. Traders may view this as a signal to buy or hold.
Bearish Breakout: When the price falls below support, it can signal strong selling interest and the potential for a continued downtrend. Traders might see this as a cue to sell or avoid buying.
20 EMA (Exponential Moving Average):
Above 20 EMA: If the stock price is above the 20 EMA, it suggests a potential uptrend or bullish momentum.
Below 20 EMA: If the stock price is below the 20 EMA, it indicates a potential downtrend or bearish momentum.
Trendline: A trendline is a straight line drawn on a chart to represent the general direction of a data point set.
Uptrend Line: Drawn by connecting the lows in an upward trend. Indicates that the price is moving higher over time. Acts as a support level, where prices tend to bounce upward.
Downtrend Line: Drawn by connecting the highs in a downward trend. Indicates that the price is moving lower over time. It acts as a resistance level, where prices tend to drop.
RSI: RSI readings greater than the 70 level are overbought territory, and RSI readings lower than the 30 level are considered oversold territory.
Combining RSI with Support and Resistance:
Support Level: This is a price level where a stock tends to find buying interest, preventing it from falling further. If RSI is showing an oversold condition (below 30) and the price is near or at a strong support level, it could be a good buy signal.
Resistance Level: This is a price level where a stock tends to find selling interest, preventing it from rising further. If RSI is showing an overbought condition (above 70) and the price is near or at a strong resistance level, it could be a signal to sell or short the asset.
Disclaimer:
I am not a SEBI registered. The information provided here is for learning purposes only and should not be interpreted as financial advice. Consider the broader market context and consult with a qualified financial advisor before making investment decisions.
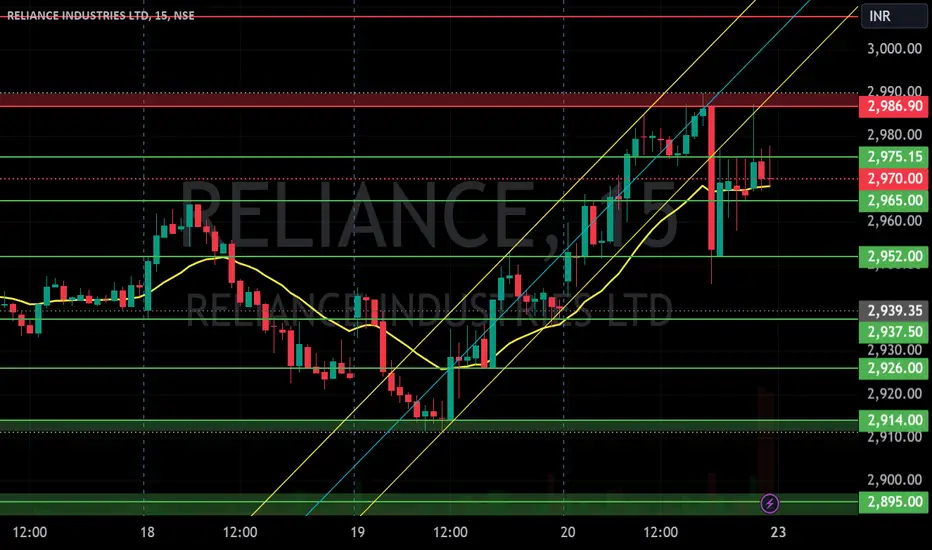
Reliance Intraday Levels : 20-Sep-24Reliance closed nr resistance and respect Trendline(both) .
Breakout of resistance & Trendline(White) can expect upside or Breakout of Trendline(Blue) & rejection from resistance can drag price downside.
Bullish> 2945
Bearish < 2935
Use SL trailing method to secure profit.

relinace buy for swing
first buy near 2870
avg at -2%
sl 4%
tgt 4%8%12%
second buy near 2780
sl 3%
tgt 3%6%9%12%

Reliance Intraday Levels: 18-Sep-24Stock in sideways in last trading session near support Zone . Wait for breakout (Downside) or Rejection (upside) for Entry.
Bullish > 2945
Bearish < 2935

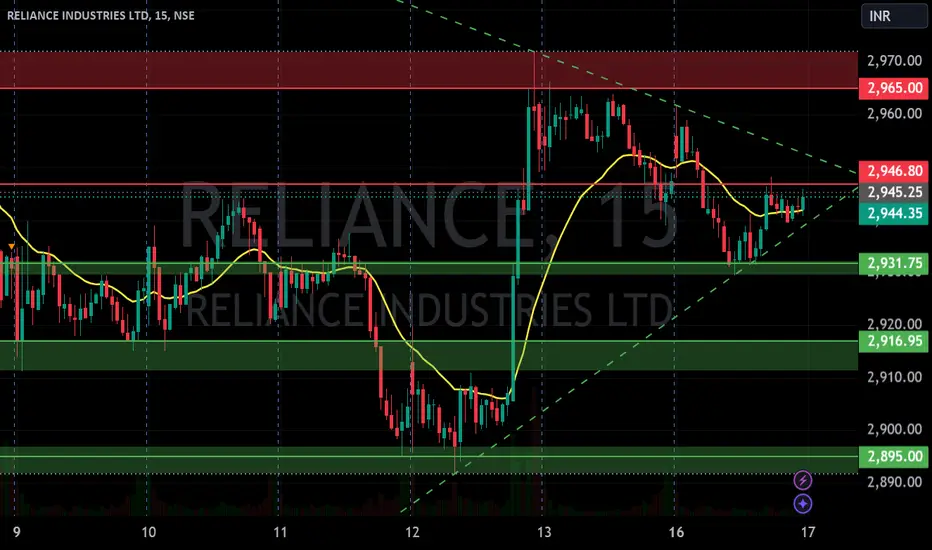
RIL S/R for 17/9/24Support and Resistance Levels:
Support Levels: These are price points (green line/shade) where a downward trend may be halted due to a concentration of buying interest. Imagine them as a safety net where buyers step in, preventing further decline.
Resistance Levels: Conversely, resistance levels (red line/shade) are where upward trends might stall due to increased selling interest. They act like a ceiling where sellers come in to push prices down.
Breakouts:
Bullish Breakout: When the price moves above resistance, it often indicates strong buying interest and the potential for a continued uptrend. Traders may view this as a signal to buy or hold.
Bearish Breakout: When the price falls below support, it can signal strong selling interest and the potential for a continued downtrend. Traders might see this as a cue to sell or avoid buying.
20 EMA (Exponential Moving Average):
Above 20 EMA: If the stock price is above the 20 EMA, it suggests a potential uptrend or bullish momentum.
Below 20 EMA: If the stock price is below the 20 EMA, it indicates a potential downtrend or bearish momentum.
Trendline: A trendline is a straight line drawn on a chart to represent the general direction of a data point set.
Uptrend Line: Drawn by connecting the lows in an upward trend. Indicates that the price is moving higher over time. Acts as a support level, where prices tend to bounce upward.
Downtrend Line: Drawn by connecting the highs in a downward trend. Indicates that the price is moving lower over time. It acts as a resistance level, where prices tend to drop.
RSI: RSI readings greater than the 70 level are overbought territory, and RSI readings lower than the 30 level are considered oversold territory.
Combining RSI with Support and Resistance:
Support Level: This is a price level where a stock tends to find buying interest, preventing it from falling further. If RSI is showing an oversold condition (below 30) and the price is near or at a strong support level, it could be a good buy signal.
Resistance Level: This is a price level where a stock tends to find selling interest, preventing it from rising further. If RSI is showing an overbought condition (above 70) and the price is near or at a strong resistance level, it could be a signal to sell or short the asset.
Disclaimer:
I am not a SEBI registered. The information provided here is for learning purposes only and should not be interpreted as financial advice. Consider the broader market context and consult with a qualified financial advisor before making investment decisions.
Reliance LongReliance
MTF Analysis
Reliance Corp Yearly Breakout 2625
Reliance Corp 6 Month Demand Breakout 2625
Reliance Corp Qtrly Demand BUFL 2614
Reliance Corp Monthly BUFL 2614
Reliance Corp Weekly bufl 2792
Reliance Corp dAILY DMIP 2887
ENTRY 2887
SL 2791
RISK 96
Target 3553
REWARD POINT 666
Last High 3220
RR 6.94
RR 23%

RELIANCE Bearish Setup on 05 Sep 2024There was Bearish Engulf setup on 5th Sep day closing.
Although, this was not convincing for the trade, as the market was consolidating in a range. The ideal setup would have been if there were 3 candles below the 4th Sep candle.

RIL S/R for 9/9/24Support and Resistance Levels:
Support Levels: These are price points (green line/shade) where a downward trend may be halted due to a concentration of buying interest. Imagine them as a safety net where buyers step in, preventing further decline.
Resistance Levels: Conversely, resistance levels (red line/shade) are where upward trends might stall due to increased selling interest. They act like a ceiling where sellers come in to push prices down.
Breakouts:
Bullish Breakout: When the price moves above resistance, it often indicates strong buying interest and the potential for a continued uptrend. Traders may view this as a signal to buy or hold.
Bearish Breakout: When the price falls below support, it can signal strong selling interest and the potential for a continued downtrend. Traders might see this as a cue to sell or avoid buying.
20 EMA (Exponential Moving Average):
Above 20 EMA: If the stock price is above the 20 EMA, it suggests a potential uptrend or bullish momentum.
Below 20 EMA: If the stock price is below the 20 EMA, it indicates a potential downtrend or bearish momentum.
Trendline: A trendline is a straight line drawn on a chart to represent the general direction of a data point set.
Uptrend Line: Drawn by connecting the lows in an upward trend. Indicates that the price is moving higher over time. Acts as a support level, where prices tend to bounce upward.
Downtrend Line: Drawn by connecting the highs in a downward trend. Indicates that the price is moving lower over time. It acts as a resistance level, where prices tend to drop.
RSI: RSI readings greater than the 70 level are overbought territory, and RSI readings lower than the 30 level are considered oversold territory.
Combining RSI with Support and Resistance:
Support Level: This is a price level where a stock tends to find buying interest, preventing it from falling further. If RSI is showing an oversold condition (below 30) and the price is near or at a strong support level, it could be a good buy signal.
Resistance Level: This is a price level where a stock tends to find selling interest, preventing it from rising further. If RSI is showing an overbought condition (above 70) and the price is near or at a strong resistance level, it could be a signal to sell or short the asset.
Disclaimer:
I am not a SEBI registered. The information provided here is for learning purposes only and should not be interpreted as financial advice. Consider the broader market context and consult with a qualified financial advisor before making investment decisions.


Potential Bullish Breakout in Reliance IndustriesSummary: The chart analysis for Reliance Industries Ltd. (NSE: RELIANCE) indicates the formation of an Inverse Head and Shoulders pattern, which is a classic bullish reversal signal. The stock is currently trading around ₹3,024.55 and appears to be testing a crucial resistance level.
Key Observations:
Inverse Head and Shoulders Pattern:
Left Shoulder: Formed around late May to early June.
Head: The low in mid-July.
Right Shoulder: Developed by late August.
This pattern suggests that the previous downtrend may be reversing, signaling a potential upward movement.
Neckline Resistance:
The neckline of this pattern is observed around ₹3,150.05.
A breakout above this level with significant volume could confirm the bullish trend, potentially pushing the stock towards higher levels.
Target Price:
Based on the height of the pattern, the projected target price post-breakout could be approximately ₹3,278.60, reflecting a gain of around 4.4% from the current price.
Volume Analysis:
Noticeable volume spikes accompany the recent price action, especially as the right shoulder forms, suggesting increasing buying interest.
Moving Averages:
The stock is currently trading above the 20-day, 50-day, and 100-day EMA, reinforcing the bullish sentiment.
The 200-day EMA is below the current price, which acts as a strong support.
RSI (Relative Strength Index):
The RSI is hovering around 54.04, indicating neither overbought nor oversold conditions. This neutral RSI provides ample room for upward momentum if the breakout occurs.
Conclusion:
Investors should watch for a decisive breakout above the ₹3,150 level. If the stock breaches this resistance with strong volume, it could signal a continuation of the uptrend towards the target price of ₹3,278.60. However, failure to break the neckline could see the stock retracing to lower support levels.
Note: Always consider the broader market context and your risk tolerance before making any trading decisions. Happy trading!

Reliance Industries in Breakout if crosses above 3055Reliance Industries NSE:RELIANCE in Breakout if crosses above 3055.
Buy @ 3055 and First Target would be 3200 and Next Target would be 3350. The Last Target would take some time and it would be better to book profits at 3200 and then proceed based on your personal Choice.

Reliance Industries indicates Bullish Pattern Reliance industries (CMP : 3019) trading in a uptrend range from April.There is good upside opportunity in this share.
Entry Price : 3020-3045
Target : 3325+ (10%)
Stop Loss : 2898
Risk Reward Ratio = 1:3

RIL S/R for 2/9/24Support and Resistance Levels:
Support Levels: These are price points (green line/share) where a downward trend may be halted due to a concentration of buying interest. Imagine them as a safety net where buyers step in, preventing further decline.
Resistance Levels: Conversely, resistance levels (red line/shade) are where upward trends might stall due to increased selling interest. They act like a ceiling where sellers come in to push prices down.
Breakouts:
Bullish Breakout: When the price moves above resistance, it often indicates strong buying interest and the potential for a continued uptrend. Traders may view this as a signal to buy or hold.
Bearish Breakout: When the price falls below support, it can signal strong selling interest and the potential for a continued downtrend. Traders might see this as a cue to sell or avoid buying.
20 EMA (Exponential Moving Average):
Above 20 EMA: If the stock price is above the 20 EMA, it suggests a potential uptrend or bullish momentum.
Below 20 EMA: If the stock price is below the 20 EMA, it indicates a potential downtrend or bearish momentum.
Trendline: A trendline is a straight line drawn on a chart to represent the general direction of a data point set.
Uptrend Line: Drawn by connecting the lows in an upward trend. Indicates that the price is moving higher over time. Acts as a support level, where prices tend to bounce upward.
Downtrend Line: Drawn by connecting the highs in a downward trend. Indicates that the price is moving lower over time. It acts as a resistance level, where prices tend to drop.
RSI: RSI readings greater than the 70 level are overbought territory, and RSI readings lower than the 30 level are considered oversold territory.
Combining RSI with Support and Resistance:
Support Level: This is a price level where a stock tends to find buying interest, preventing it from falling further. If RSI is showing an oversold condition (below 30) and the price is near or at a strong support level, it could be a good buy signal.
Resistance Level: This is a price level where a stock tends to find selling interest, preventing it from rising further. If RSI is showing an overbought condition (above 70) and the price is near or at a strong resistance level, it could be a signal to sell or short the asset.
Disclaimer:
I am not a SEBI registered. The information provided here is for learning purposes only and should not be interpreted as financial advice. Consider the broader market context and consult with a qualified financial advisor before making investment decisions.

Reliance Ind next target 3000 to 3075A new breakout will be seen in Reliance Industries in one to two days, this breakout is indicating that it is bullish, as three inside candles have formed on the daily chart and the biggest candle in it is a bullish candle. Which is giving preference to the fact that a breakout will be seen in the bullish direction of Reliance Industries.

Reliance Industries a blue chip wealth creator stockReliance Industries is a very good stock for long term and after optimistic agm minutes and futuristic commentary regarding Ai cloud and data centres , it is right time to add on dips and with a long view to make it wealth creator stock..

RIL S/R for 26/8/24Support and Resistance Levels:
Support Levels: These are price points (green line/share) where a downward trend may be halted due to a concentration of buying interest. Imagine them as a safety net where buyers step in, preventing further decline.
Resistance Levels: Conversely, resistance levels (red line/shade) are where upward trends might stall due to increased selling interest. They act like a ceiling where sellers come in to push prices down.
Breakouts:
Bullish Breakout: When the price moves above resistance, it often indicates strong buying interest and the potential for a continued uptrend. Traders may view this as a signal to buy or hold.
Bearish Breakout: When the price falls below support, it can signal strong selling interest and the potential for a continued downtrend. Traders might see this as a cue to sell or avoid buying.
20 EMA (Exponential Moving Average):
Above 20 EMA: If the stock price is above the 20 EMA, it suggests a potential uptrend or bullish momentum.
Below 20 EMA: If the stock price is below the 20 EMA, it indicates a potential downtrend or bearish momentum.
Trendline: A trendline is a straight line drawn on a chart to represent the general direction of a data point set.
Uptrend Line: Drawn by connecting the lows in an upward trend. Indicates that the price is moving higher over time. Acts as a support level, where prices tend to bounce upward.
Downtrend Line: Drawn by connecting the highs in a downward trend. Indicates that the price is moving lower over time. It acts as a resistance level, where prices tend to drop.
RSI: RSI readings greater than the 70 level are overbought territory, and RSI readings lower than the 30 level are considered oversold territory.
Combining RSI with Support and Resistance:
Support Level: This is a price level where a stock tends to find buying interest, preventing it from falling further. If RSI is showing an oversold condition (below 30) and the price is near or at a strong support level, it could be a good buy signal.
Resistance Level: This is a price level where a stock tends to find selling interest, preventing it from rising further. If RSI is showing an overbought condition (above 70) and the price is near or at a strong resistance level, it could be a signal to sell or short the asset.
Disclaimer:
I am not a SEBI registered. The information provided here is for learning purposes only and should not be interpreted as financial advice. Consider the broader market context and consult with a qualified financial advisor before making investment decisions.

RELIANCEReliance (Daily)
CMP 2999
Currently taking support around 2900 - 3000 levels
Trendline support
Consolidating in range 2900 - 3000
