Sail : Approaching Near Resistance Sail : Approaching near Resistance
136 is the first resistance level to be watched out for and than major Red Band Resistance as displayed on the Chart
( Not a Buy / Sell Recommendation
Do your own due diligence ,Market is subject to risks, This is my own view and for learning only .)
SAIL trade ideas

SAIL at Best Support !!This is the 4 hour Chart of STEEL AUTHORITY OF INDIA .
SAIL having a good law of polarity at 125 range .
SAIL has formed a broadening pattern indicating the uptrend.
if this level is sustain then we may see higher prices in SAIL.
Thank You !!

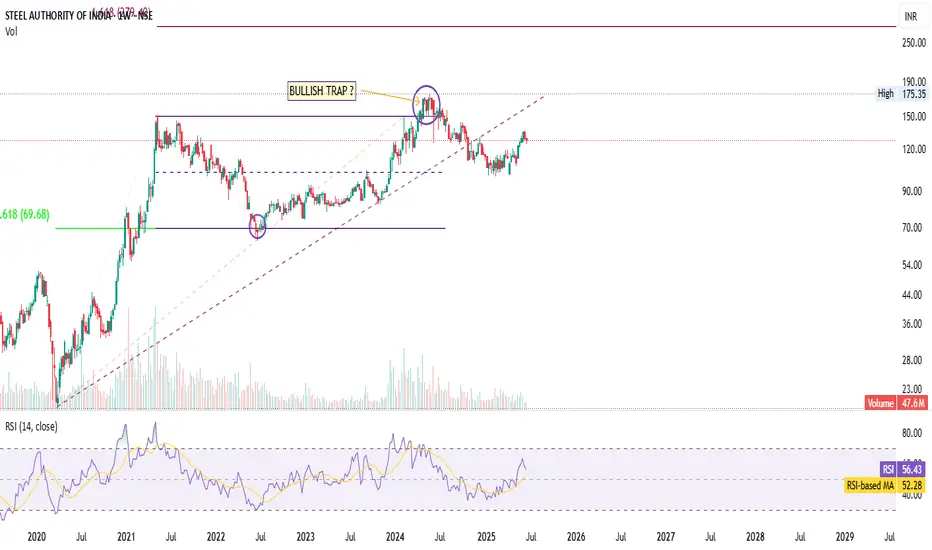
SAIL-Post-Bull Trap Recovery, New base forming!High at ₹175.35 marked — confirmed historical resistance.
Fibonacci 0.618 retracement level at ₹69.68 — acted as a key support in the past.
Important demand zone retest (marked in purple) was successful and led to the current uptrend.
2. Bullish Trap Highlighted:
The marked "Bullish Trap?" zone shows a classic false breakout above previous highs, followed by a reversal —
Volume also dropped after this area, supporting the trap hypothesis.
3. Trendlines:
Ascending dotted trendline is respected and acted as a pivot for recent price action.
Good visual use of multi-year structure with clean diagonals.
4. RSI Analysis:
RSI at 56.43 is trending upward and above its MA (52.28) → confirms bullish momentum.
Previously RSI bounced from sub-40 zones → indicating bottoming structure.
5. Volume Analysis:
Spikes in volume correlate with bottoms, confirming accumulation activity.
🧾 Summary
SAIL appears to have completed a bullish trap at around ₹175 and went into a corrective phase.
Found strong support at the long-term trendline and 0.618 Fib level (₹69.68).
Current structure is rebounding from higher low, forming a potential new base.
RSI and price action confirm renewed strength — trend resumption is likely
Sail BullishAfter a long consolidation at the bottom Sail has formed a Bullish engulfing candle at the bottom and giving a breakout of the resistance level.
Entry- 111-112
Support- 107.5-107
Target- 120, 125
Disclaimer- This is just for educational purpose please take advice from your financial advisor before making any decision.
Jai Shree Ram

Sail : Fantastic rally after a Buy Signal ,sitting at a first reSail : Fantastic rally after a Buy Signal , sitting at a first resistsnce as seen on the Chart.
( Not a Buy / Sell Recommendation
Do your own due diligence ,Market is subject to risks, This is my own view and for learning only .)

SailCurrent Price: 111.57
Upside: 125.87, 130.79, 136.01 and 141.23
Downside: 107.89, 102.95, 97.73 and 92.51
#Sail

SAILSAIL looks bullish, breaking out from a multi-year range. In Elliott Wave 3, it could see strong upside, supported at recent lows, with resistance at prior highs. Expect robust momentum.

SAIL - LONGNSE:SAIL Weekly rounding bottom formation possible with buyers active near buying location. Macd also shows some momentum intact on chart.

SAIL : After a fantastic Buy Signal ,sitting at a Red band SAIL : After a fantastic Buy Signal ,sitting at a Red band resistance as displayed in the Chart
Closed above 200 SMA with a nice green Candle .
( Not a Buy / Sell Recommendation
Do your own due diligence ,Market is subject to risks, This is my own view and for learning only .)

Sail is sailing higher Here's a quick analysis of SAIL (Steel Authority of India Ltd.) stock:
Technical Overview
- Current Price: ₹122.61 INR
- Market Cap: ₹479.14 billion
- P/E Ratio: 22.56 (Moderate valuation)
- Dividend Yield: 1.72% (Stable returns)
- 52-Week Range: ₹99.15 - ₹175.35
Recent Trends
- The stock has been in a downtrend but is showing signs of reversal.
- Key Support Levels: ₹112.40 - ₹118.45.
- Breakout Potential: Analysts suggest a possible bullish trend with a 25% upside target.
Breakout Signals
- Double Rectangle & Falling Wedge Pattern: These formations indicate buyer dominance and a possible bullish trend.
- Key Resistance Level: ₹134 INR—recent trading action suggests a strong push above this level.
- Volume Surge: A 5% price increase with high trading volumes supports the breakout possibility.
Fundamental Insights
- Revenue & Profit: Recent results show degrowth in revenue and operating profit margins.
- Institutional Interest: FIIs (Foreign Institutional Investors) have been increasing their shareholding, which could indicate long-term confidence.
Investment Outlook
- Strengths: Strong institutional backing, potential trend reversal.
- Weaknesses: Near 52-week low, declining revenue.
- Opportunities: If the breakout holds, short-term gains could be significant.
- Threats: Market volatility, global steel demand fluctuations.🚀

$sailthis is gonna fly from here on solid reaction from previous range low
lets reclaim 126.85 then teleport to 144.2 targeting 165 as before
check out the rsi

SAIL1. SAIL is taking strong support at this zone, given the market condition is exremtly volatile.
2. Volume is gaining
3. RSI momentum indicator is gaining strenth
4. candles are very small few days, where we get low risk trades
Do your own anlysis before invest.
if this is usful then please encourage myself with your comments and booster

SAIL: Trade Idea in CashThere are several factors at play, but all can still fail.
RSI Divergence: Positive divergence on daily and weekly charts.
Pattern: Formation of a W-pattern on the daily chart, now retesting the range
Key Levels: Price near the 200-week moving average and a long-term trendline (since 2020).
Candlestick: Engulfing candle formed earlier on the weekly chart.
Breakout: Upper trendline resistance has been broken.
These signals suggest a bullish scenario, but risks remain due to potential failures.

SAIL📊 Price Action & Trend Analysis
Analyzing market trends using price action, key support/resistance levels, and candlestick patterns to identify high-probability trade setups.
Always follow the trend and manage risk wisely!
Price Action Analysis Interprets Market Movements Using Patterns And Trends On Price Charts.

SWING IDEA - SAILSAIL Stock Technical Analysis
Steel Authority of India Limited ( NSE:SAIL ) has been consolidating around the 95 resistance level for over a year. After multiple attempts, the stock finally broke out above this level in January 2024, turning it into a strong support zone.
Following the breakout, SAIL surged to a peak of 175, marking an 85% gain. However, the stock then saw a sharp retracement, correcting by nearly 47% and revisiting the rising trendline support around the 100-105 range. This level, which previously acted as resistance, has now become a critical demand zone.
Currently, SAIL is showing signs of renewed bullish momentum, bouncing off its trendline support and forming a potential reversal. The weekly MACD crossover, observed in the chart, further reinforces a trend reversal signal. Additionally, a short-term upside target of 12% is indicated, while a long-term potential target of 76% upside is visible in the chart, aligning with the previous swing high.
The chart also highlights three take-profit targets:
Target 1: The first profit-taking zone, offering an initial opportunity to secure gains.
Target 2: A mid-level profit-taking zone, aligning with previous consolidation areas.
Target 3: The final take-profit level around 175, marking the prior high and a potential full exit point for long-term investors.
KEY OBSERVATIONS:
One-year resistance of 95 was decisively broken in January 2024
Stock surged 85% to a high of 175 before correcting 47%
100-105 level now acts as a strong rising trendline support
Weekly MACD crossover signals a bullish momentum shift
Three take-profit targets identified, with the final target at 175
Potential upside target of 76% from support levels, aligning with previous highs
RECOMMENDATION:
Based on this technical analysis, holding SAIL for the long term could be a strong strategy. The potential returns include:
12% upside in the short term
76% upside from current levels, targeting previous highs around 175
This analysis presents a compelling buying opportunity in SAIL, fueled by its breakout, support validation, and momentum reversal.
IMPORTANT NOTE:
Investors should be aware that there is a chance the stock may retest the 100-105 support level before resuming its upward trajectory. This potential pullback should be carefully monitored, and investment strategies should be adjusted accordingly.
DISCLAIMER: This analysis is for educational and informational purposes only and should not be considered as financial advice. Technical indicators and historical data are not guarantees of future performance. Investors should conduct thorough research, assess risk tolerance, and consult a financial advisor before making any investment decisions.

SAIL SWING TRADE SETUP📊 Price Action & Trend Analysis
Analyzing market trends using price action, key support/resistance levels, and candlestick patterns to identify high-probability trade setups.
Always follow the trend and manage risk wisely!
Price Action Analysis Interprets Market Movements Using Patterns And Trends On Price Charts.
👉👉👉Follow us for Live Market Views/Trades/Analysis/News Updates.

$SAILtagged 200 ema on weekly
now would be a nice time to reclaim 110 and start our ascend to 165 levels
Dollar Index dumping would the metal sector
fed meet in 2 days
am long already from a bit higher

Sail testing the Breakout areaSail testing the breakout area of 100, Jan 2024 break out area.Looking good for long in bullish trend and in rising parallel channel.
Target 125,150,175,200 long term hold.
Educational purpose only do your own research before taking entries.

sail sail stock support oi resistance oi
100 24 lake 4 lake
105 36 lake 12.6 lake
110 42 lake 75 lake

SAIL- At its all time lowSAIL- At its all time low
1) Super Fall
2) Trendline support
3) Lets see if it could reach 450

SAIL BUY @ 115 Rs Pure invest planSail is leader in steel segment
Fundamentally strong company
Accumulate this stock from current price 115 rs
If stock go below 100 rs then add 2x qty @ 75 to 85 rs zone. And hold for 1 year ,
It will give better return than mutual fund.
Target 213 - 360 RS
We advice book 50% qty profit @ 210 rs zone.
It is pure investment .

CLOSING ABOVE 124 IS THE BUY CALL - SAIL ON SAILEverything is pretty much explained in the picture itself.
I am Abhishek Srivastava | SEBI-Certified Research and Equity Derivative Analyst from Delhi with 4+ years of experience.
I focus on simplifying equity markets through technical analysis. On Trading View, I share easy-to-understand insights to help traders and investors make better decisions.
Kindly check my older shared stock results on my profile to make a firm decision to invest in this.
For any query kindly dm.
Thank you and invest wisely.

SAIL - Elliott Wave SAIL (Steel Authority of India). It seems to be in a running or expanded correction with currently wave 'c' ongoing. Price could test either the 50% of even 61.8% fib. level before turning bullish.
