SAIL Expecting a huge breakout in upcoming weekThere is a huge consolidation in SAIL. you can buy in the upcoming trading sessions and do a swing trade to get maximum profift
SAIL trade ideas

CONSOLIDATION in sail12 days continue consolidation gng on something big is cooking inside the box 💚👍🏻
Sail breakout above 126 stop loss 116 target 135 and 150

swing high probability long tradeAs you can see on the chart sail is currently consolidating in tight range anytime breakout could and sail will fly

Sail at #Support Stock has not performed in last few weeks, it may take some time, but i think we may see goog move in upcoming days


sail target 144 in max 3 monthsSail looks like it is in a support zone, nifty metals are also pushing the price. good to hold for 3 months, good for buying now if you are looking for at least 20% gain.
31/08/21

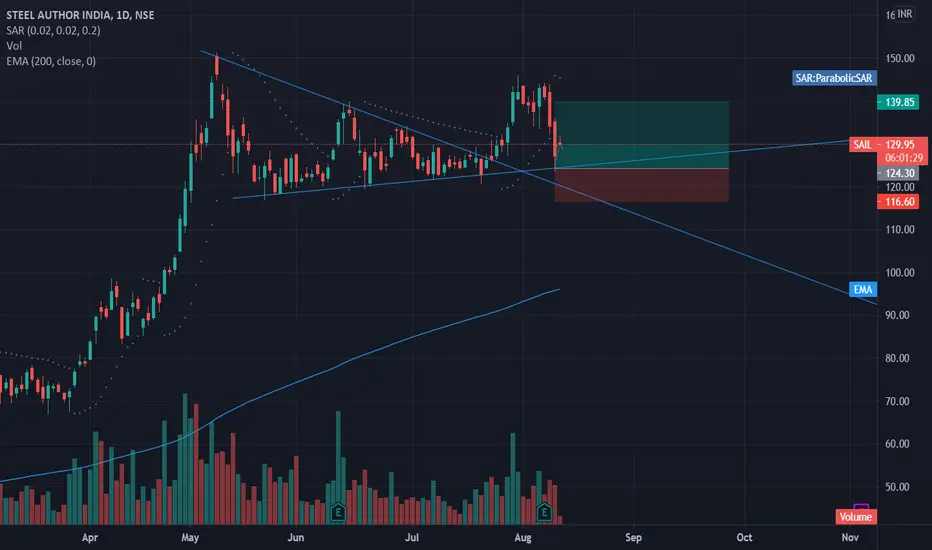
SAIL Short Term Breakout Trade The stock has broken out and retested the lower trendline and found support. Trade is supported by brokerage calls and Supports Nearby.
Risk Reward Ratio - 2:1
SL is placed below the support zone, Lower Trendline. The target is placed near swing high.
SAIL, 1 D TimeframeSAIL chart looks good to go long as stock has taken support from its major support zone and also from 50 EMA. Any close above the trendline (as mentioned in chart above) will lead to good move as per my view.
One should definitely keep an eye on this stock and not miss the breakout.

sailall details in the graph only
It is only for learning purposes. Please do not take it as financial advice.
Do comment if you have any opinion on my analysis; it will help us learn together.

#SAIL Bullish Harmonic#SAIL Bullish Harmonic
BUY above 123
SL 120
Target 135/145,160
Timeframe - 3 months
CMP: 127.25 @August 10,2021


SAILSAIL trading in Channel and last 4 Monthly candle near upper line of channel and taking resistance of it.

SAIL LOOKING FOR LONGSail for long R.j. Big bull also entered in this stock few days ago
also making bullish chart pattern.
fundamentally strong stock for now..

Breakout in SAILSail has made a Bekakout from the previous high and about to reach the first target in few days could proceed with a medium quantity and SL @ 126.50


Sail...........Will it SAIL ???Seems to be stuck in the two level mentioned..
any dip towards the trend line.... to be carefully bought into...
Like... Share... Follow...

triangle may formHello All how are u ? after long time . keep eyes on sail as triangle is forming, sellers are drying up bulls seems accumulating throughout triangle. price is making HL not in mood to go down i think.

STEEL AUTHORITY OF INDIA Ascending Triangle breakout, RSI and Volume is building up .Target on the chart

SAIL can sail upward (Swing/ Positional)HI all,
Simple support and tested dynamic resistance 50 ema as well.
people who want to take risk can go for target of 150, 150 + with support of 116.4.
Estimated time is 2- 4 weeks.
Please manage your risk.

Triangle Pattern SAILFundamental
The stock fundamentals are very good, and the price of steel has gone up which will benefit the organisation.
News
Rakesh has got a good amount of shares in the portfolio.
Technical, Triangle pattern has formed with decreasing volume, Expecting a breakout. Enter the trade when it breaks out with stop loss slightly below the triangle pattern.

Sail long Looks good overall and steel sector is doing well so may go up
Disclaimer: I'm not a sebi registered guy

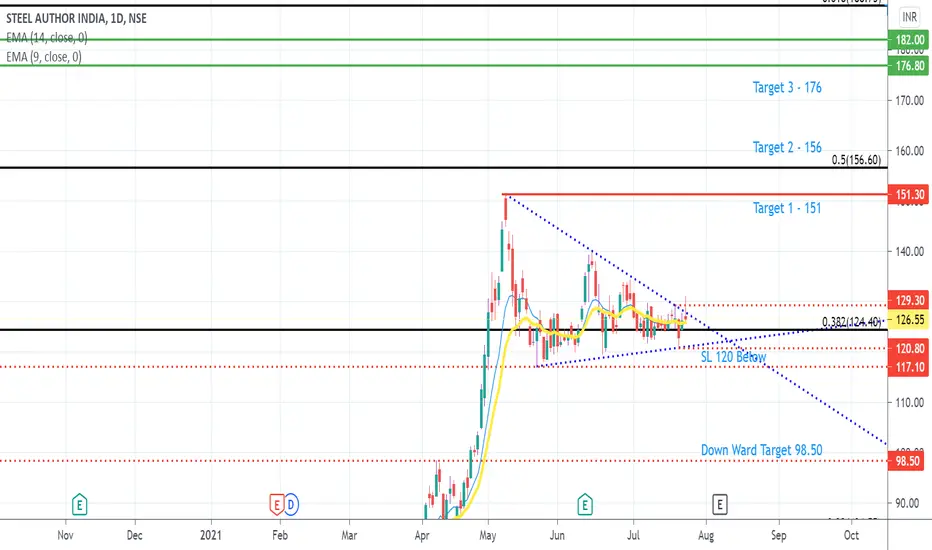
SAIL BULLISH PENNANT PATTERN NSE:SAIL
I am strongly bullish on this stock.
It's just a view of mine. Fundamentally Strong company expecting a good Quarterly result.
Expecting a break out on July last Week.
Currently trading in a Bullish Pennant pattern and in strong support Zone 124.40 to 120.80. Breaking Below to 120.80 will lead to a fall to 117.10 breaking that we can see a fall to 98.50.
Already have a position With SL Below 120.80 / Target 161 to 176 depend on the adjustment.
SAIL Flag or TriangleAs a Beginner I am analysing the SAIL forming a Triangle and breaking the same and starts Bullish signal
