SBICARD: Bullish Butterfly Harmonic Pattern - @Godfreystocks77Technical Analysis
The butterfly pattern is forming, with the PRZ at 882 as the 1.272 extension of the XA leg from the recent drop to 914.50 (July 2 close). With the stock at 909.30, it’s near support around 900-905. A reversal zone (e.g., 905-900) is key for entry confirmation—look for a bullish candlestick or RSI upturn. The 52-week high of 1,027.25 remains a long-term target if momentum builds.
Fundamental Catalyst
On July 2, 2025, SBICARD fell 2% (-0.32%) to 914.50 after Goldman Sachs downgraded it to 'Neutral' from 'Buy', setting a 1,006 target (8% upside). The move follows a 30% six-month rally, raising valuation concerns (P/E > 46) and credit cost focus. Despite a 5% drop in five days and a GST notice (Rs 81.93 crore ITC disallowance), Goldman sees strong medium-term growth, supporting a bullish case.
Market Sentiment
The downgrade tempers short-term optimism, but active trade (25 lakh shares) and institutional backing suggest resilience. A reversal above 910 could trigger the butterfly pattern, targeting 882, with potential to reach 1,006 if fundamentals improve.
Trade Idea
Entry: 905-900 on reversal confirmation (e.g., bullish candle at support).
Target: 882 (PRZ), with a stretch to 1,006.
Stop Loss: 895 (below support).
Risk/Reward: 1:2.5.
Wait for reversal zone before entry. Follow @Godfreystocks77 for updates!
Monitor volume and news on GST or trade deals to confirm the setup.
SBICARD trade ideas

bearish pattern The appearance of an M pattern, following a bullish trend often signals a diminishing momentum of buyers

SBI Card : Almost at the Sell Signal. Fingers Crossed SBI Card : Almost at the Sell Signal. Fingers Crossed .
( Not a Buy / Sell Recommendation
Do your own due diligence ,Market is subject to risks, This is my own view and for learning only .)

Bull divergence at lower level , means bulls for coming back.Here we are going for long in SBICARD through its running in all time high. it's showing bullishness. So, a long trade should be initiated here by seeing RSI indicator there it's running above 50 level means bullishness can be seen in this stock.

SBI Cards in Symmetrical Traiangle PatternNSE:SBICARD formed a Symmetrical Traiangle Pattern. We can Target for 980 as a Safe target. You can still proceed and keep a Second target for 1160, however it would be Risk Reward and try to achieve keeping Trailing Stoploss. Safe Target would be 980.

IPO Price Respected — Now Coiling for a Major Breakout?
🔍 Chart Context & Structure
Since its listing, SBI Cards & Payment Services Ltd (NSE: SBICARD) has been forming a massive accumulation base on the weekly chart — with an iron-clad support zone around ₹650. Over the last 3.5 years, the stock never closed below this IPO zone, signaling strong institutional confidence and long-term investor conviction.
Now, after multiple failed attempts, price is retesting the crucial ₹930–₹972 resistance band — a level that previously triggered sharp rejections. But this time, the setup is different:
✅ Momentum is building with a consistent series of higher lows.
✅ The structure now hints at a rounding bottom formation.
✅ Volume is supportive (if visible), and sentiment around financials is shifting positive.
📊 Technical Zones to Watch
Zone Relevance
🔵 ₹660–₹715 Strong base zone (IPO support + demand cluster)
🟣 ₹930–₹972 Historical supply zone (tested 3rd time now)
🟠 ₹1,130–₹1,150 Minor resistance, could break quickly post breakout
🟡 ₹1,272 – ₹1,440 Fibonacci targets (1.272–1.618 extension)
🔴 ₹1,916 Final positional target (2.618 Fib extension from pandemic low)
🌐 The Macro Tailwinds
💳 Credit card usage in India is booming – penetration is still low compared to global norms, but monthly user growth is accelerating.
🏛️ Government is actively promoting digital payments – a key pillar in India’s fintech roadmap.
📈 Financialization of Indian households – from cash hoarding to credit leverage, behavior is shifting.
🔁 Consumer spending is rebounding strongly post-COVID and SBI Cards is a direct proxy.
💡 Investor Psychology
Think of the ₹930–₹972 zone like a "psychological lid". Price got rejected here twice before — so this third approach carries both hesitation and anticipation. A weekly close above this zone would likely:
Trigger short-covering from swing sellers,
Attract momentum traders,
And validate long-term bulls waiting for confirmation.
📌 Trading Plan (Positional Swing)
Entry Trigger: Weekly close above ₹972
Initial Target: ₹1,130 → ₹1,192
Medium-Term Targets: ₹1,272 → ₹1,343 → ₹1,440
Long-Term Target: ₹1,916
Stop-Loss (Weekly): Close below ₹880
Holding Period: 6 months to 2 years depending on breakout strength
🧠 Final Thought
"Not closing below IPO levels for over 3 years in a volatile mid-cap is not random — it's informed accumulation."
With digital payment adoption surging and tailwinds aligning, SBI Cards may be quietly entering a new phase of price discovery. Watch the ₹972 zone closely — what was resistance may soon become the launchpad.

SBICARDNSE:SBICARD
Note :
1. One should go long with a Stop Loss, below the Trendline or the Previous Swing Low.
2. Risk :Reward ratio should be minimum 1:2.
3. Plan your trade as per the Money Management and Risk Appetite.
Disclaimer :
>You are responsible for your profits and loss.
>The idea shared here is purely for Educational purpose.
>Follow back, for more ideas and their notifications on your email.
>Support and Like incase the idea works for you.

SBI CARD – Breakout Watch | Trendline Resistance TestedSBICARD is currently at a crucial technical juncture. After a long consolidation and multiple rejections from a descending trendline (marked in grey), the stock is now attempting a decisive breakout on the weekly chart.
📊 Key Observations:
Price has broken above a multi-year trendline resistance. Strong bullish candle.
Breakout level around ₹860–₹870 — previously acting as supply zone.
Volume pickup supports the breakout strength.
Immediate target shown on chart is ₹1,065, which is ~22.78% potential upside from breakout.
🎯 What to Watch:
Sustained weekly close above ₹870 could confirm breakout.
Possible retest of breakout zone before next leg up.
Stop-loss for swing traders can be placed around ₹820.
📌 Disclaimer: Not a recommendation. Do your own research and risk management.

SBI CARD : Head &Shoulder Break Out in Hrly ChartSBI CARD:: Consolidated nicely and drifted towards 830 to form the head,From there could see it bouncing bk towards 850 and in the process formed Head&shoulder pattern in hourly chart.H&S Neckline break out stands at 850 sustaining above 850 see a TGT of 860 followed by 870(For educational purpose only)

SBICARD CMP 763.SBICARD trading near IPO Listing price .Currently showing price strenth with weekly bollinger band breakout signal.Its a Trendline breakout area also on chart. It showing bottom out. It have low Risk High Reward setup. Please study chart and find your best entry exit area.

SBI CARD 1WSBI Card is displaying a compact triangle breakout with elevated volumes, signalling a potential upward trajectory. Currently positioned around ₹859 on the weekly timeframe, the stock seems set to approach its all-time high
I am not a SEBI-registered analyst or investment advisor. The information shared is for educational and informational purposes only and should not be construed as financial or investment advice. Please conduct your own research or consult with a SEBI-registered professional before making any investment decisions. Trading and investing in the stock market involve risks, and you should invest only after careful consideration of your financial situation.

SBICARD...BuyGave a triangle breakout...clean one....triangle tgt calculated and posted on chart...time tgt is roughly end of 2025 ..around half of the time taken to make the triangle..these are rough estimates...Buy for long term OR for trading for traders ..I have put in 2x supertrend as trailing stoploss

SBICARD – Descending Triangle Breakout 920 to 1100+ TargetSBICARD has been trading within a descending triangle pattern for an extended period, with lower highs and a strong horizontal support. This pattern is typically bearish but can lead to bullish breakouts when resistance is breached, as seen in this case.
Breakout Confirmation & Key Levels
Resistance Breakout:
The stock has successfully broken above the descending trendline resistance, indicating a potential trend reversal.
Buying Zone:
Above ₹800 – A sustained move above this level confirms the breakout.
Stop-Loss Level:
Below ₹750 – Any close below this level could invalidate the bullish setup.
Target Levels:
Initial Target: ₹920+
Projected Target: ₹1100+ (based on pattern height projection)

sbicardNomura observes that several major concerns are likely to ease in the near term, particularly regarding asset quality, driven by the following factors:
1) The share of metro regions in credit card debt has been gradually increasing since FY23, while the leverage and limit levels of non-metro customers have been declining.
2) SBI Cards has seen a growing contribution from the top eight metro cities in its new customer acquisitions.
3) SBI Cards has seen a rise in net card addition in November 2024 by 231,000, which is the highest since December 2023.
These developments suggest that asset quality issues should stabilise in the next few quarters, positively impacting the company's return profile in FY26, according to Nomura.

SBI cardAs it appears from the chart the down move in sbi card ia complete forming a normal flat pattern. It seems that it is going to give a good target in upcoming montha

Weekly Long opportunity SBI CardsAgain, I was tracking this share.
1. Monthly engulfing candle, where we see fall in nifty. As this is large cap
2. Few months back large pin bar at bottom
3. More volume at green candle.
4. FII and DII have large stake in this business.
Can keep this week low for short term trader but if nifty flies, this counter can run faster. Make your due diligence with limited quantity. Long term can keep for 15 to 18 months.

SBI CARD
SBI CARD
Support Levels:
740
745
Resistance Levels:
760
770
Would you like to know more about the technical indicators or recent market trends for SBI Card?

Long SBICARD a medium term trade ideaNSE:SBICARD is showing beautiful outperformance on charts compared to indices NSE:CNXFINANCE in last few weeks, above all moving averages, long due underformer
This might go for few more rounds of support retesting but eventually poised to move near 900 and above. One can buy with time horizon of 6 months and more...

SBI CARDS & PAY SER LTD Trade SetupHello,
Trend-Based Analysis. Buy the Dips, Sell The Rallies, Also Following the Trend. Let's see where the Price Action takes us, Riding the wave. Potential trade setups based on trend momentum.
Technical analysis based on trend identification and momentum, Looking for high-probability setups within the prevailing trend.
Analyzing the current market trend and potential future price movement. Focusing on risk management and reward-to-risk ratios.
Details is Mentioned in Chart, Read carefully.. .

sbi cardCurrent Share Price: ₹664.45 (as of December 31, 2024)
Market Capitalization: ₹63,155 crore
52-Week High: ₹817.40
52-Week Low: ₹647.95
PE Ratio: 28.58
EPS (TTM): ₹23.23
PB Ratio: 5.23
Face Value: ₹10.00
Dividend Yield: 0.38%
Given your support level of ₹670,680 and resistance level of ₹700, it seems like the stock is currently trading near the support level. Do you have any specific investment plans or need further analysis on this stock?

sbi card cash level 690 to 700 RS for investment Hello frds ,
buy SBI card @ 690 to 700 zone
Target 980 Rs than 1100 RS within 1 year
its pure investment call .

SBICARD AnalysisI have analyzed SBICARD with different GANN technique. I have considered it trend as well. Based on that i am see more weakness in this SBICARD. Target is 611, 579

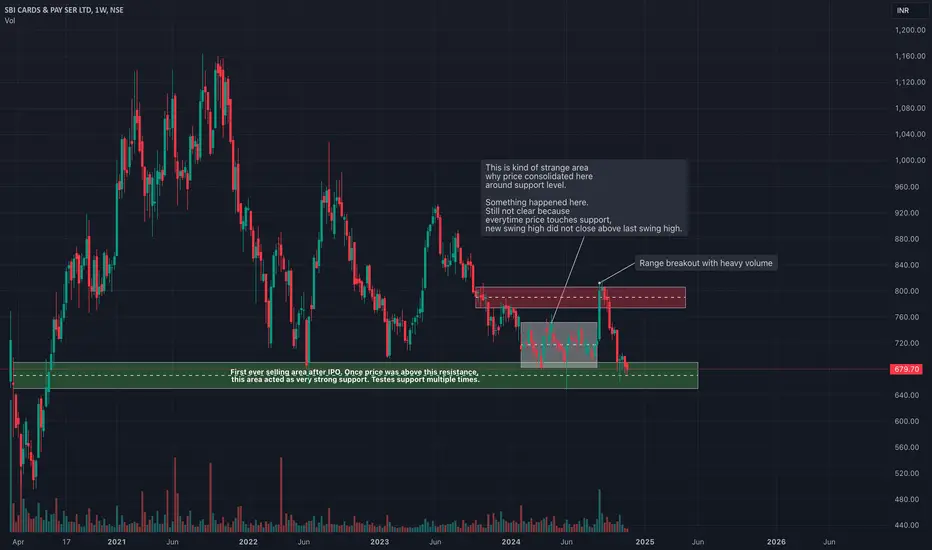
SBI Card: No change in down trendSBI Card has bounced back from support level multiple time. In fact too many times.
Whenever it has bounced back to make a swing high, it seems buying was not strong enough to take it above last swing high overall (igonoring minor swing highs).
- There is strange consolidation near support level. It never happened in past but something is changed in stock's behavior here.
- The stock even gave break out above the range formed with heavy volume, but volume and price action did not follow through. Most likely seems to attract liquidity.
Conclusion:
- It seems like price will continue same bearish trend unless there is decisive closing above 820 levels.
- Might be sideways or might reach near life time low before going up.
Still not ready to buy for long term.