SBI Long 780-780 Target 880 & 1020SBI Yearly Breakout 542
SBI 6 Month Breakout 660
SBI Weekly & daily Demand 793-720 Average 755
SBIN trade ideas

SBIN : 10-25% Down??SBI
Key points:
1. Goldman Sachs downgrades SBI to "Sell"
2. Healthy red candle with volume on the daily chart appeared after 24 day's of consolidation. Means bears have accumulated energy during that phase
3. Institutional selling on this counter (Reason unknown, so far)
4. 2 order blocks are pending to be re-visited by the price )around 700 and 600 levels.
5. Bulls should wait till these levels show some reversal.

SBI Bank ChartThere are multiple lines of support around 790 levels. Though there is also a downward flag pattern, there are multiple levels of support(blue lines) and 2 support trend lines converging at that region.
I would use these multiple factors to ape into the trade.


SBIN upside target 840, 850State Bank of India may see good bullish momentum this week, the stock is on a bullish breakout on the daily chart, breaking which could show the stock a good rally. This stock can also see targets up to 840. The stock has also closed with a gain of five percent in today's session. The stock has also seen a bullish engulfing candlestick pattern on the daily chart indicating a good uptrend in the stock.

Sbi ready for upmoveTriangle breakout in SBI.it looks Ready for next upmove
Next level look like 831, 841

SBIN: Watch for Breakout - Bullish or Bearish?
Bullish Breakout Level: Above ₹832.15
Potential Upside: Targeting ₹899
Bearish Breakout Level: Below ₹794.75
Potential Downside: Targeting ₹731.10
Critical Juncture: The stock is at a key decision point. Monitor closely for a breakout in either direction to plan your trade.

Sbi breakout TimeSbi bank is now on monthly basis deep side there is an important level.now it's gonna be running time.

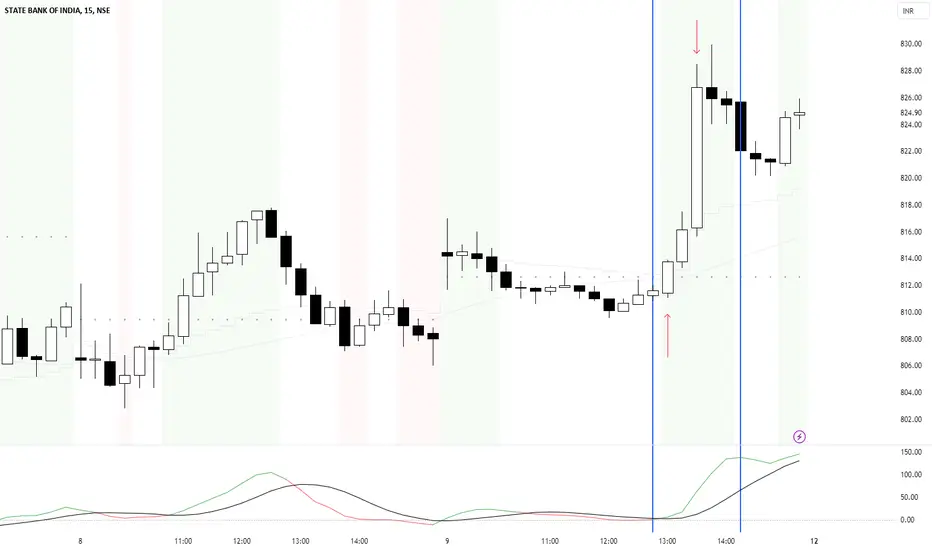
SBIN#SBIN : Consider going long on SBIN if it manage to cross 820.80 - 821. It has room for 9 more points. (829 -830)

STATE BANK OF INDIA S/R Support and Resistance Levels:
Support Levels: These are price points (green line/share) where a downward trend may be halted due to a concentration of buying interest. Imagine them as a safety net where buyers step in, preventing further decline.
Resistance Levels: Conversely, resistance levels (red line/shade) are where upward trends might stall due to increased selling interest. They act like a ceiling where sellers come in to push prices down.
Breakouts:
Bullish Breakout: When the price moves above resistance, it often indicates strong buying interest and the potential for a continued uptrend. Traders may view this as a signal to buy or hold.
Bearish Breakout: When the price falls below support, it can signal strong selling interest and the potential for a continued downtrend. Traders might see this as a cue to sell or avoid buying.
20 EMA (Exponential Moving Average):
Above 20 EMA: If the stock price is above the 20 EMA, it suggests a potential uptrend or bullish momentum.
Below 20 EMA: If the stock price is below the 20 EMA, it indicates a potential downtrend or bearish momentum.
Trendline: A trendline is a straight line drawn on a chart to represent the general direction of a data point set.
Uptrend Line: Drawn by connecting the lows in an upward trend. Indicates that the price is moving higher over time. Acts as a support level, where prices tend to bounce upward.
Downtrend Line: Drawn by connecting the highs in a downward trend. Indicates that the price is moving lower over time. It acts as a resistance level, where prices tend to drop.
RSI: RSI readings greater than the 70 level are overbought territory, and RSI readings lower than the 30 level are considered oversold territory.
Combining RSI with Support and Resistance:
Support Level: This is a price level where a stock tends to find buying interest, preventing it from falling further. If RSI is showing an oversold condition (below 30) and the price is near or at a strong support level, it could be a good buy signal.
Resistance Level: This is a price level where a stock tends to find selling interest, preventing it from rising further. If RSI is showing an overbought condition (above 70) and the price is near or at a strong resistance level, it could be a signal to sell or short the asset.
Disclaimer:
I am not a SEBI registered. The information provided here is for learning purposes only and should not be interpreted as financial advice. Consider the broader market context and consult with a qualified financial advisor before making investment decisions.

Next Big move on State Bank Of IndiaNext Big move on State Bank Of India
Wait for volume confirmation for Longs as price is at the Fib Golden zone, Rejected at order block with fair value gap, Wait for the trend line brake with volume. take a lower time frame long entry to increase risk to reward ratio..

State Bank of India intraday level for 16th Aug #SBIN State Bank of India intraday level for 16th Aug #SBIN
Buying may witness above 811
Support area 803. Below ignoring buying momentum for intraday
Selling may witness below 795
Resistance area 803. Above ignoring selling momentum for intraday
Charts for Educational purposes only.
Please follow strict stop loss and risk reward if you follow the level.
Thanks,
V Trade Point

STATE BANK OF INDIA S/R Support and Resistance Levels:
Support Levels: These are price points (green line/share) where a downward trend may be halted due to a concentration of buying interest. Imagine them as a safety net where buyers step in, preventing further decline.
Resistance Levels: Conversely, resistance levels (red line/shade) are where upward trends might stall due to increased selling interest. They act like a ceiling where sellers come in to push prices down.
Breakouts:
Bullish Breakout: When the price moves above resistance, it often indicates strong buying interest and the potential for a continued uptrend. Traders may view this as a signal to buy or hold.
Bearish Breakout: When the price falls below support, it can signal strong selling interest and the potential for a continued downtrend. Traders might see this as a cue to sell or avoid buying.
20 EMA (Exponential Moving Average):
Above 20 EMA: If the stock price is above the 20 EMA, it suggests a potential uptrend or bullish momentum.
Below 20 EMA: If the stock price is below the 20 EMA, it indicates a potential downtrend or bearish momentum.
Disclaimer:
I am not a SEBI registered. The information provided here is for learning purposes only and should not be interpreted as financial advice. It's important to remember that while these indicators can be useful, they are not foolproof. Always consider the broader market context and consult with a qualified financial advisor before making any investment decisions.

State Bank of India intraday level for 9th Aug #SBIN State Bank of India intraday level for 9th Aug #SBIN
Buying may witness above 815
Support area 805. Below ignoring buying momentum for intraday
Selling may witness below 789
Resistance area 800 Above ignoring selling momentum for intraday
Charts for Educational purposes only.
Please follow strict stop loss and risk reward if you follow the level.
Thanks,
V Trade Point

SBIN (State bank Of India)Stock corrected significantly from life time high of 911 made on 3-June-2024 and currently trading at 810.. which is 11% drop.
I See the nearest support level is 793
long term & short term traders can add in the accumulation zone between 750-793
Stop loss - 720 (Strictly follow)
long term investors can accumulate up to 622 levels
Targets : 911 / 987 / 1107
This idea is only for education purpose and not for real time trading & investing. kindly consult your financial adviser before investing

Monthly outlook HDFC, ICICI & SBI Bank + BANKNIFTYHello Traders,
I have shared the demand and supply zone for monthly outlook for your ease. Hope you like this analysis.

HDFC bank, ICICI Bank and SBI Bank analysisHello Traders,
Both ICICI Bank and HDFC bank have now retracted from quarterly supply zone. This means that we wont see a new high before September expiry. This was clearly evident in todays sell and confirm that sellers are sitting in heavy quantities.

SBIN-SHORTBearishtrend in formation on SBIN Price action suggests further upside potential. Key support and resistance levels to watch. Consider short position with appropriate risk management.

SBIN LONG 4 HR TRADEOn 240 mins, there are 2 levels, one below the other. Hence, either combine 2 levels or enter the distal line of 1 level and hold till SL or target.

SBIN-LONGTraders can consider long positions on a confirmation from order flow with appropriate risk management strategies.

SBIN- Analysis
757 above this bullish and 724 below this bearish
Bullish Levels -above 757 then 827 to 861 then 1034 to 1068 then then 1241 to 1275 then 1448 to 1482 then 1655 to 1689
Bearish levels :- Below 724 then 620 (SL level)
**Disclaimer -
I am not a SEBI registered analyst or advisor. I does not represent or endorse the accuracy or reliability of any information, conversation, or content. Stock trading is inherently risky and the users agree to assume complete and full responsibility for the outcomes of all trading decisions that they make, including but not limited to loss of capital. None of these communications should be construed as an offer to buy or sell securities, nor advice to do so. The users understands and acknowledges that there is a very high risk involved in trading securities. By using this information, the user agrees that use of this information is entirely at their own risk.
Thank you.

State Bank of IndiaTARGET MENTIONED IN CHART
SL - 545
PURELY TECHNICAL CALL
FUNDAMENTALS
Market Cap
₹ 5,52,612 Cr.
Current Price
₹ 619
High / Low
₹ 630 / 499
Stock P/E
8.14
Book Value
₹ 402
Dividend Yield
1.84 %
ROCE
5.20 %
ROE
16.8 %
Face Value
₹ 1.00
Promoter holding
57.5 %
EPS last year
₹ 62.4
EPS latest quarter
₹ 18.0
Debt
₹ 49,89,687 Cr.
Pledged percentage
0.00 %
Net CF
₹ -80,593 Cr.
Price to Cash Flow
-6.42
Free Cash Flow
₹ -90,057 Cr.
Debt to equity
13.9
OPM last year
41.8 %
OPM 5Year
35.3 %
Reserves
₹ 3,58,039 Cr.
Price to book value
1.53
Int Coverage
1.41
PEG Ratio
0.11
Price to Sales
1.39
Sales growth 3Years
9.14 %
Profit Var 3Yrs
50.0 %
