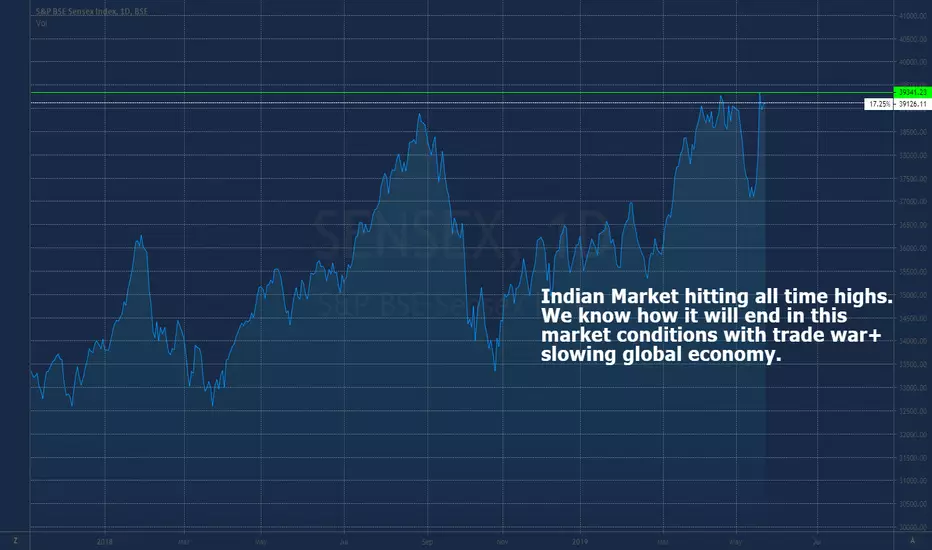
SENSEX trade ideas


Waiting For the Gap To Be FilledGap fills are easy to predict, they happen, they may take time, but they happen. After the last gap up, we still haven't seen the market close that gap. If the market wants to go further, let's wait for this to be gap to be filled.

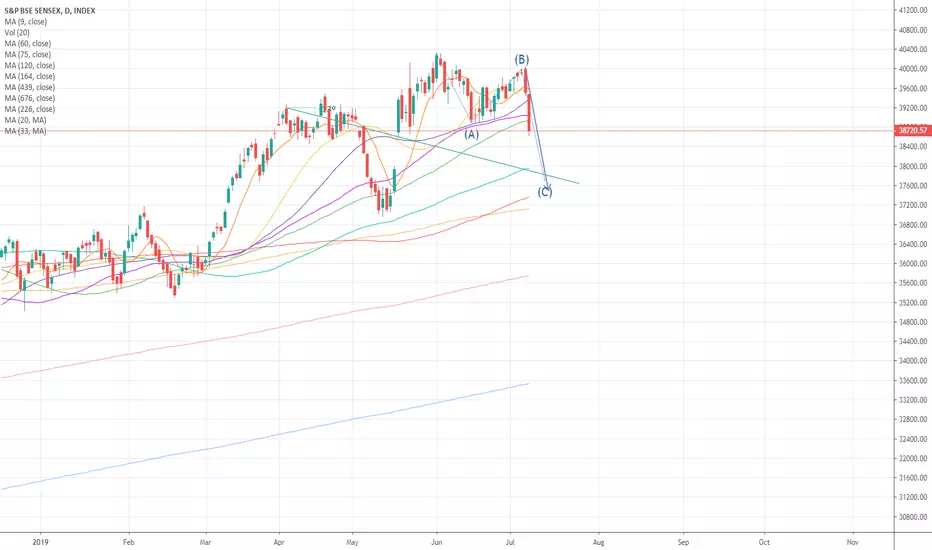
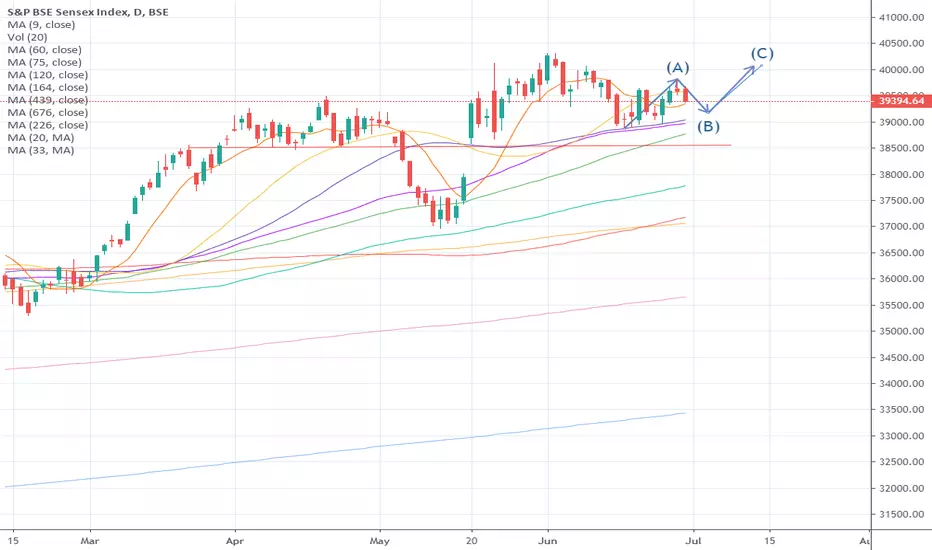
Sensex Index UP Coming Trend Analysis Hi
we believe that there exist a Three Drive Pattern for which it takes few days to complete and then we have a bearish retracement for which we may Short the Market.
The Fundamental analyses are base on the current Oil Price and problems in Middle East and as we have analysed the NIFTY, we can conclude there is a upcoming Bearish Trend as the Oil Pries may go Higher so the companies should face the Demand issues and their productivity comes down so their stock price...
Best of Luck
Trade Sensibly
please write your ideas for us so we can discus and develop our knowledge


Time to short BSE Sensex?It's been a long while, are we finally done with the runup? Will we see a Santa Clause rally or are traders going to be getting ready for the hols, and sell for the new year? December could be a lower trend... but hey, let's not predict anything :)

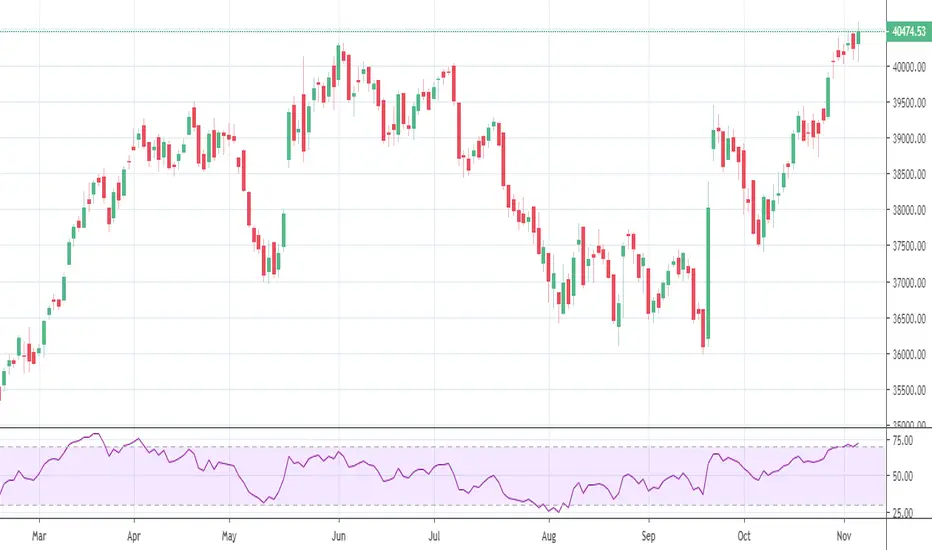
BSE:SENSEX is at ATH but got rejected by a year old trendlineBSE:SENSEX has recorded a All Time High today(26-Nov-19) but it was rejected by a trendline that extends from August 2018 till today. If this trendline is broken on a daily closing basis then I am expecting SENSEX to continue to the upside.

#SENSEX #IndianMarkets Going Down till 34000 #TechnicalAnalysisBears will be in control. 34000 is in range. RSI downward.


Inverted Head and shoulders on Sensex 05-Sep-2019Expect the bull bounce to continue upto 39300 by Sep-end or mid-Oct

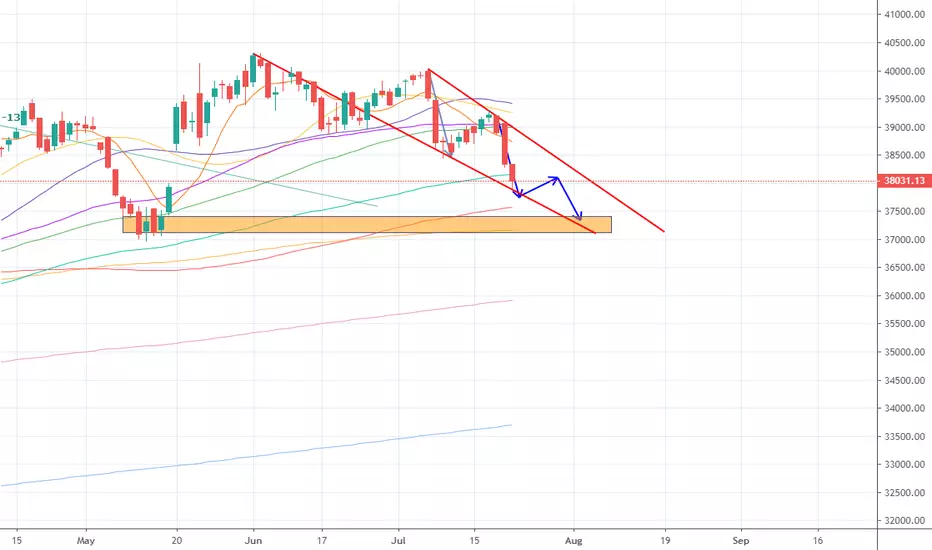
Drop in SENSEX is expected BSE:SENSEX
Price has broken down the trend line and is in a Pull back structure. May test 39000 (psychological level) which is also the base of trendline, previous support and near a FIB level.
If pullback is confirmed then price may test 33-34000 range.
Viewing at uncertainties globally, drop seems likely.


Daily India SENSEX stock market index forecast analysis22-Jul
Price trend forecast timing analysis based on pretiming algorithm of Supply-Demand(S&D) strength.
Investing position: In Falling section of high risk & low profit
S&D strength Trend: In the midst of a downward trend of strong downward momentum price flow marked by temporary rises and strong falls.
Today's S&D strength Flow: Supply-Demand(S&D) strength flow appropriate to the current trend.
View forecasts shape of candlestick 10 days in the future: www.pretiming.com
Forecast D+1 Candlestick Color : RED Candlestick
%D+1 Range forecast: 0.4% (HIGH) ~ -0.6% (LOW), -0.2% (CLOSE)
%AVG in case of rising: 0.9% (HIGH) ~ -0.2% (LOW), 0.6% (CLOSE)
%AVG in case of falling: 0.3% (HIGH) ~ -0.9% (LOW), -0.6% (CLOSE)
Daily India SENSEX forecast analysis08-JUL
Price trend forecast timing analysis based on pretiming algorithm of Supply-Demand(S&D) strength.
Investing position: In Falling section of high risk & low profit
S&D strength Trend: In the midst of a downward trend of strong downward momentum price flow marked by temporary rises and strong falls.
Today's S&D strength Flow: Supply-Demand(S&D) strength flow appropriate to the current trend.
read more: www.pretiming.com
D+1 Candlestick Color forecast: RED Candlestick
%D+1 Range forecast: 0.0% (HIGH) ~ -0.7% (LOW), -0.5% (CLOSE)
%AVG in case of rising: 0.9% (HIGH) ~ -0.2% (LOW), 0.6% (CLOSE)
%AVG in case of falling: 0.3% (HIGH) ~ -0.9% (LOW), -0.6% (CLOSE)
India SENSEX daily, bearish wedgeThe Indian index SENSEX was forming a bearish wedge on its daily candlestick, waiting it to break below the line, short term target is 38,000.


India Strong Economics Long For Long TermA huge economic power that owns the atomic weapon with a population of 1340 million people. Or half of the population is under 25 years old. Very young and very dynamic country where there is everything to build. Despite the 7% growth per year, this is not enough to give work to all new young people who are 1 million every month. This ensures a level of cheap hands for export to the international. India has great ambitions to become number 1 globally. I buy against wind and fed up.

Daily India SENSEX stock market index forecast timing analysis 27-Jun
Price Forecast timing analysis by pretiming algorithm of Supply-Demand strength
Investing position about Supply-Demand(S&D) strength: In Rising section of high profit & low risk
Supply-Demand(S&D) strength Trend Analysis: About to begin an adjustment trend as a upward trend gradually gives way to a slowdown in rises and falling fluctuations
Today's S&D strength Flow: Supply-Demand strength has changed from a strong buying flow to a suddenly strengthening selling flow.
read more: www.pretiming.com
D+1 Candlestick Color forecast: RED Candlestick
%D+1 Range forecast: 0.1% (HIGH) ~ -0.9% (LOW), -0.4% (CLOSE)
%AVG in case of rising: 0.9% (HIGH) ~ -0.2% (LOW), 0.6% (CLOSE)
%AVG in case of falling: 0.5% (HIGH) ~ -0.7% (LOW), -0.3% (CLOSE)
Price Forecast timing is analyzed based on pretiming algorithm of Supply-Demand(S&D) strength.
Daily SENSEX forecast timing analysis by Supply-Demand strength20-Jun
Stock investing strategies
Investing position about Supply-Demand(S&D) strength: In Falling section of high risk & low profit
Supply-Demand(S&D) strength Trend Analysis: In the midst of a rebounding trend of upward direction box pattern stock price flow marked by limited falls and upward fluctuations.
Today's S&D strength Flow: Supply-Demand(S&D) strength flow appropriate to the current trend.
View a Chart with Supply-Demand(S&D) strength forecast: www.pretiming.com
D+1 Candlestick Color forecast: GREEN Candlestick
%D+1 Range forecast: 0.8% (HIGH) ~ -0.1% (LOW), 0.3% (CLOSE)
%AVG in case of rising: 0.9% (HIGH) ~ -0.2% (LOW), 0.6% (CLOSE)
%AVG in case of falling: 0.4% (HIGH) ~ -0.8% (LOW), -0.6% (CLOSE)
Stock Price Forecast Timing Criteria: Stock price forecast timing is analyzed based on pretiming algorithm of Supply-Demand(S&D) strength.