ShreecemCurrent Price: 29710
Upside: 32277.50, 32946.88 and 33616.25
Downside: 28707.50, 28038.13 and 27368.75
Next report date
—
Report period
—
EPS estimate
—
Revenue estimate
—
311.20 INR
11.23 B INR
190.72 B INR
9.83 M
About SHREE CEMENT LTD
Sector
Industry
CEO
Neeraj Akhoury
Website
Headquarters
Kolkata
Founded
1979
ISIN
INE070A01015
FIGI
BBG000CZMTR1
Shree Cement Ltd. engages in the manufacturing of cement and related products. The company's brand names include Shree Ultra, Bangur, and Rock Strong. It operates through Within India and Outside India geographical segments. The company was founded on October 25, 1979 and is headquartered in Kolkata, India.
Related stocks

Invert Head and shoulder + cup with handle + 2x Double bottomOkay so I tried naming this pattern but gave up halfway because:
There’s a clean Inverted Head & Shoulders
A perfectly awkward Cup with Handle
And not one but two Double Bottoms, stacked like technical lasagna
All that drama right under the same resistance zone
👹 The red rectangle? I
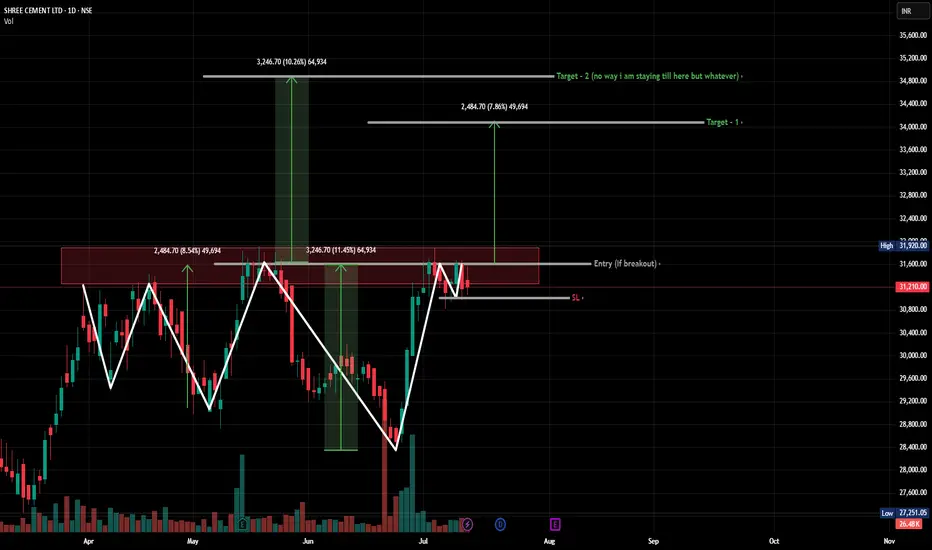
Shree CementCup and handle pattern formed , which is quite basic but the main reason for the trade is that it seems share is being acccumulatrd at every level and has not yet shown any specific upmove in any rally of nifty. so break out is awaited and tgt has been mentioned.
SHREECEM | Buy @LTP with Strict SL below 26800Disclaimer:
This is not financial advice. Please do your own research or consult with a financial advisor before making any investment decisions. Investments in stocks can be risky and may result in loss of capital.

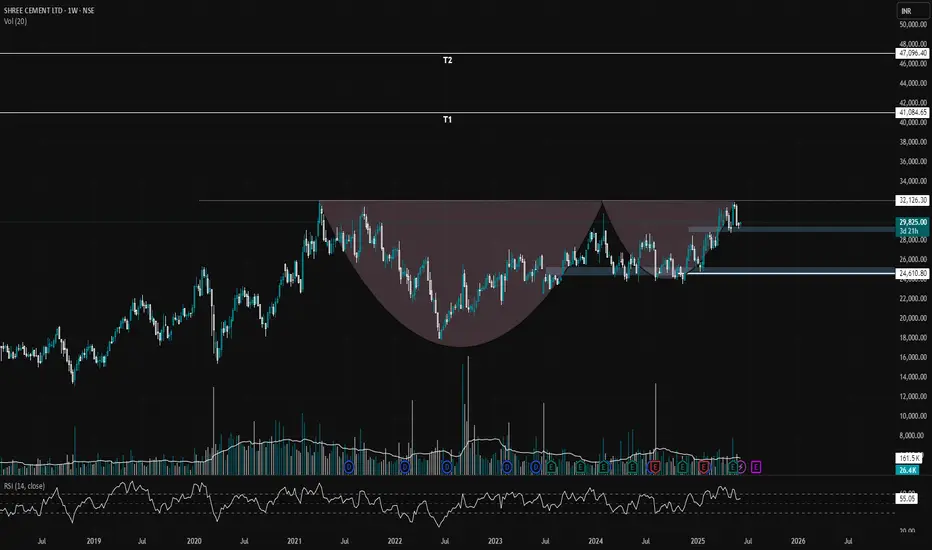
ShreeCem - Breakout retest Shreecem after breaking out on weekly timeframe is now retesting the levels.
Looks a good opportunity to add for the next bull run in this sector as well as stock.

# Shree Cement , 1W and 1D Good Looking Pattern for Breakout , Bullish Pattern
It is Positional Setup .
Enter when the Upper Trendline Breaks and
Be careful when You enter because They are chance to happen false breakout . Avoid False Breakout by Considering the Nifty50 Trend .
aim for 30% in short Term and aim for up t

shree Cement short 25790.00 from current price levelHello Frds,
Shree Cement looks poor , short from current price level 25790.00
Stop loss 28800.00
Target Expected 18000- 18500 Zone
its pure positional trade.

Shree Cement Ltd view 12th Nov #SHREECEM Shree Cement Ltd view 12th Nov #SHREECEM
Resistance 25550-25600
Strongest Support 23950-24000. This support took four times so we can expect weakness if touches again.
Charts for Educational purposes only.
Please follow strict stop loss and risk reward if you follow the level.
Thanks,
V Trade P

SHREE CEMENT S/R Support and Resistance Levels:
Support Levels: These are price points (green line/shade) where a downward trend may be halted due to a concentration of buying interest. Imagine them as a safety net where buyers step in, preventing further decline.
Resistance Levels: Conversely, resistance levels (re

SHREECEM Bullish Buy
Flag formed in shreecem but there is resistance zone highlighted as block for this bullish pattern.

See all ideas
Summarizing what the indicators are suggesting.
Neutral
SellBuy
Strong sellStrong buy
Strong sellSellNeutralBuyStrong buy
Neutral
SellBuy
Strong sellStrong buy
Strong sellSellNeutralBuyStrong buy
Neutral
SellBuy
Strong sellStrong buy
Strong sellSellNeutralBuyStrong buy
An aggregate view of professional's ratings.
Neutral
SellBuy
Strong sellStrong buy
Strong sellSellNeutralBuyStrong buy
Neutral
SellBuy
Strong sellStrong buy
Strong sellSellNeutralBuyStrong buy
Neutral
SellBuy
Strong sellStrong buy
Strong sellSellNeutralBuyStrong buy
Displays a symbol's price movements over previous years to identify recurring trends.
Frequently Asked Questions
The current price of SHREECEM is 30,653.25 INR — it has decreased by −0.54% in the past 24 hours. Watch SHREE CEMENT LTD. stock price performance more closely on the chart.
Depending on the exchange, the stock ticker may vary. For instance, on BSE exchange SHREE CEMENT LTD. stocks are traded under the ticker SHREECEM.
SHREECEM stock has fallen by −3.07% compared to the previous week, the month change is a −2.07% fall, over the last year SHREE CEMENT LTD. has showed a 9.67% increase.
We've gathered analysts' opinions on SHREE CEMENT LTD. future price: according to them, SHREECEM price has a max estimate of 35,700.00 INR and a min estimate of 21,500.00 INR. Watch SHREECEM chart and read a more detailed SHREE CEMENT LTD. stock forecast: see what analysts think of SHREE CEMENT LTD. and suggest that you do with its stocks.
SHREECEM reached its all-time high on Jul 22, 2025 with the price of 32,508.20 INR, and its all-time low was 84.75 INR and was reached on Oct 29, 2003. View more price dynamics on SHREECEM chart.
See other stocks reaching their highest and lowest prices.
See other stocks reaching their highest and lowest prices.
SHREECEM stock is 1.55% volatile and has beta coefficient of 0.85. Track SHREE CEMENT LTD. stock price on the chart and check out the list of the most volatile stocks — is SHREE CEMENT LTD. there?
Today SHREE CEMENT LTD. has the market capitalization of 1.11 T, it has decreased by −0.59% over the last week.
Yes, you can track SHREE CEMENT LTD. financials in yearly and quarterly reports right on TradingView.
SHREE CEMENT LTD. is going to release the next earnings report on Aug 4, 2025. Keep track of upcoming events with our Earnings Calendar.
SHREECEM earnings for the last quarter are 154.10 INR per share, whereas the estimation was 143.12 INR resulting in a 7.67% surprise. The estimated earnings for the next quarter are 159.58 INR per share. See more details about SHREE CEMENT LTD. earnings.
SHREE CEMENT LTD. revenue for the last quarter amounts to 52.40 B INR, despite the estimated figure of 51.15 B INR. In the next quarter, revenue is expected to reach 51.75 B INR.
SHREECEM net income for the last quarter is 5.74 B INR, while the quarter before that showed 1.93 B INR of net income which accounts for 196.96% change. Track more SHREE CEMENT LTD. financial stats to get the full picture.
SHREE CEMENT LTD. dividend yield was 0.36% in 2024, and payout ratio reached 35.35%. The year before the numbers were 0.41% and 15.81% correspondingly. See high-dividend stocks and find more opportunities for your portfolio.
As of Aug 2, 2025, the company has 21.28 K employees. See our rating of the largest employees — is SHREE CEMENT LTD. on this list?
EBITDA measures a company's operating performance, its growth signifies an improvement in the efficiency of a company. SHREE CEMENT LTD. EBITDA is 39.65 B INR, and current EBITDA margin is 19.99%. See more stats in SHREE CEMENT LTD. financial statements.
Like other stocks, SHREECEM shares are traded on stock exchanges, e.g. Nasdaq, Nyse, Euronext, and the easiest way to buy them is through an online stock broker. To do this, you need to open an account and follow a broker's procedures, then start trading. You can trade SHREE CEMENT LTD. stock right from TradingView charts — choose your broker and connect to your account.
Investing in stocks requires a comprehensive research: you should carefully study all the available data, e.g. company's financials, related news, and its technical analysis. So SHREE CEMENT LTD. technincal analysis shows the neutral today, and its 1 week rating is buy. Since market conditions are prone to changes, it's worth looking a bit further into the future — according to the 1 month rating SHREE CEMENT LTD. stock shows the buy signal. See more of SHREE CEMENT LTD. technicals for a more comprehensive analysis.
If you're still not sure, try looking for inspiration in our curated watchlists.
If you're still not sure, try looking for inspiration in our curated watchlists.