BUY LONG From listing till now shown a good technical zone rebound that trading in zone we can take benefit of this current upward trend for almost 23 %
SIS trade ideas

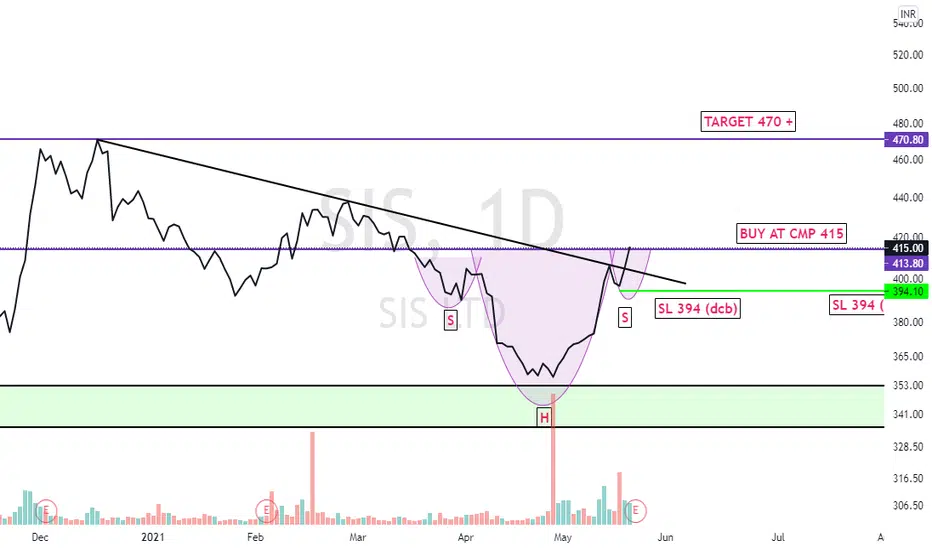
SIS BREAK OUT & RETESTSIS can double from here with in few years. Sl below the trend line.
Chart is self explanatory. Please follow the price action & take the trade as per your appetite.
The information provided here is only for educational purpose. The information provided here is not intended to be any kind of financial advice, investment advice, and trading advice. Investment in stock market is very risky and trading stocks, options and other securities involve risk. The risk of loss in stock market can be substantial. Moreover, I am not a SEBI registered analyst, so before taking any decision or before investing in any Share consult your financial advisor and also do your analysis and research.
Request your support and engagement by liking and commenting & follow to provide encouragement.

SIS LTDStock may show now higher high and high low pattern in upcoming days
Looking for big move
Do your own analysis before investing

SIS: 6 Years = One plate Pani Puri!Here is one interesting case study showing that despite good fundamentals, some companies will underperform.
- SIS was listed at a price of 815 in 2017
- It later had a stock split from FV of Rs. 10/Share to Rs. 5/Share. For every share exchanged, Investors got 2 shares.
- So, technically with the current price chart (post-split), the adjusted listing price would be half i.e., around 410
(Example: say, the value of the company was 500 with 10 outstanding shares, So the value per share was 50. Now, after the stock split, outstanding shares became 20. So now the value will be 500/20 i.e., 25.)
- CMP is 440
- After 6 long years, Investors received an appreciation of 30 Rs + Rs. 9 as dividends. We are a rupee short for a plate of pani puri here in Mumbai :P
Have Requests, Questions, or Suggestions? DM us or comment below.👇
⚠️Disclaimer: We are not registered advisors. The views expressed here are merely personal opinions. Irrespective of the language used, Nothing mentioned here should be considered as advice or recommendation. Please consult with your financial advisors before making any investment decisions. Like everybody else, we too can be wrong at times ✌🏻

SIS NEAR BREAKOUTsis is looking very good and chances are very in favor of breaking this long resistance and will start its upward journey
STOCK FUNDAMENTALS:
PE-18
MKTCAP-6398
ROE-14.85%
DE- 0.71

Processing Multi-Year Trend Breakout in SIS?It has been respecting the trend in a weekly timeframe from past few years and nearing to the trend after a pull back from an attempt made to breakout a few days ago.
Interested to see how it unfolds. may go long if it breaks out with strong volume with limited SL.


SIS: End of a volatile cycle? Ready for accumulationAfter the recent sudden spike, inspite of breaking the low, a volume spike with no time spent below the all time low, we can expect a steady accumulation once it spends some time in the support zone of 350-380
Bounces of the support zome will be a sign to accumulate and hold for an upmove.

SIS Ltd Trend AnalysisFundamentals are good, revenue has increased more than 10 times in 11 years but OPM dropped by 66% due to increase in employee cost which is concerning.
Borrowings increased to almost 100% but trade receivables & cash equivalents can make it up to 87.5%.
Technically price is about to reach the base of the big descending triangle as highlighted and forming strong bullish divergence with RSI.
Good to accumulate around 360-400 levels for the following targets:
Short term swing target @ 490 (29% ROI from CMP)
Medium term swing target @ 660 (73% ROI from CMP)
Long term swing target @ 800 (110% ROI from CMP)
Mandatory stop loss @ 320
Do your own due diligence before taking any action.
Peace!!


Breakout with Volumes in SIS LtdSIS Ltd looks like a good buy as the stock has given a technical breakout with good volumes and has also retested the breakout level properly.
The stock can be bought in Range 540-550.
Target can be 590
StopLoss can be 510


SIS - short term tradeStock: SIS
Trade type: Short term
Entry: 540
Analysis: A beautiful stage strucutre, Prolonged consolidation can be seen, Just in a urge of breakout. If it so happen a good ROI is expected. Cup and handle can also be seen. Details on the chart.

SISThis security company many Indians must know about has formed a nice 3-year range. Could be a good long trade on successful breakout.

SIS LTD i have mentioned everything on charts work with a SL which is need to below 350 and believe on the technical
thanks


SIS future multibagger?SIS COMPANY is a reputed Indian Partnership Firm engaged in the business of production and import & export of buffalo meat. We possess Abattoir cum meat processing plant where our work is carried out under clean and hygienic environment.


TGT : 437 , 17% TGTWhy Buy :
1 - Oversold ( RSI-25)
2 - Buy Signal in Wavetrend Signal
TGTs :
1 : 404 - 8.5%
2 : 437 - 17%
3 : 464 - 24%
* Bought 100sh @ 364.5 ( 2% of portfolio )
Financials :
20% Sales and Profit Growth , Positive EPS and low CMP to Sales.


