Buy SunpharmaBuy Sunpharma on basis of Double Bottom with RSI Positive Divergence
Stops and Targets are as mentioned in the charts.
SUNPHARMA trade ideas

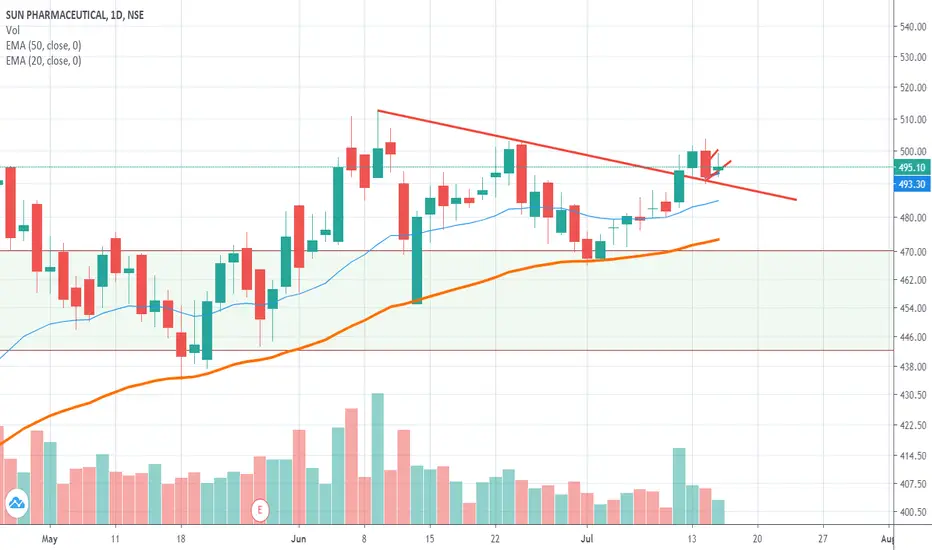
SunPharma - Bull Flag - Long above 506NSE:SUNPHARMA is continuously getting hammered.
Long only above when the closing is above 506.


SUN PHARMA - 6 YEAR BREAK OUT ZONE Sun Pharma again making an attempt to break out the 6 year long reistance area of 500-510. Let us see this time if it can cross and sustain...! Since this is like a zone, a more comfort will be above 515 for long term investment.
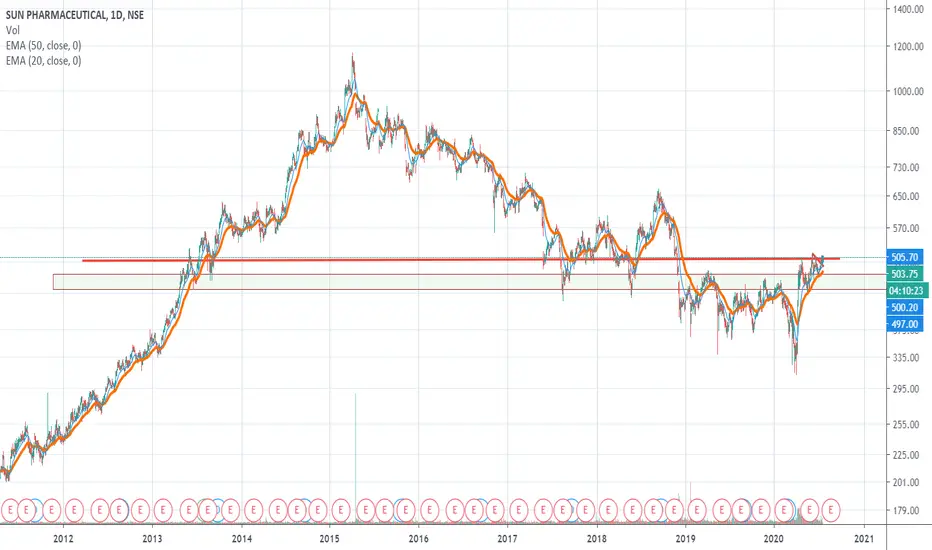
Sun Pharma - Is it Breaking Out? Sun Pharma - Is it Breaking out? Breakout, Retest...! A meaningful B/o. is only above 503 - Retest Candle. Today;s indecissive candle does not give confidence, but let us se..

SUNPHARMANSE:SUNPHARMA
The OI addition in the upper strikes shows there might be upside coming, the march highs of 485-483 range can be taken as a support for targets of 500, 505, 513 and 520.
**********************************************************************************************************************************************
Hi all,
Its pleasure to have you all here.
I have started putting these charts as a contribution from my side to all people who are new to business, as I had to struggle a lot without any sources at disposal. So please consider this a just small contribution from my side.
Few Honest Disclosures:
1. Any idea shared is my personal view, its not a recommendation, neither any kind of paid propaganda, so please
do your bit of research.
2. Ideas shared does not mean that I trade all or have position in them, this is just a helping hand to all.
3. I expect no comments or like nor any negativity, as I said its just a small helping hand from my side, please plan your risk and trade as per your capacity.
4. To trade in Cash, options or futures is your sole choice and your own risk
5. I am no expert in Tech Indicators, I believe in support resistance and trendline theory, you may use this as a supplement theory for better results.
6. I work for my own living, this is a hobby which I do sincerely to help anyone who might come across my charts.
***********************************************************************************************************************************************
Sunpharma - Entering into selling zoneSunpharma can be shorted around 505 to 507 as it is entering into selling territory.
I think it should fall one more time from 505 range before giving out breakout.
It will be bullish above 513

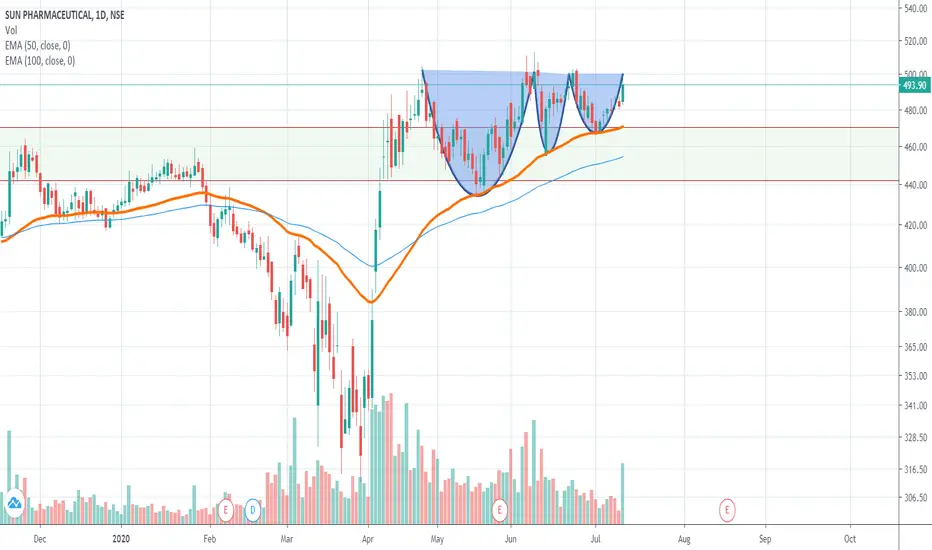
Sun Pharma - Double Handle Waala CupSun Pharma - Forming a Double Handle Waala Cup...!
PS: that was just for fun. Just in case it ever get a recognised pattern trademark, remember me to have invented. Ha... Ha... Ha...!
sun pharma buyonce crosses resistance zone of 500 to 512 with volume target of 650 to 750 for 3rd wave


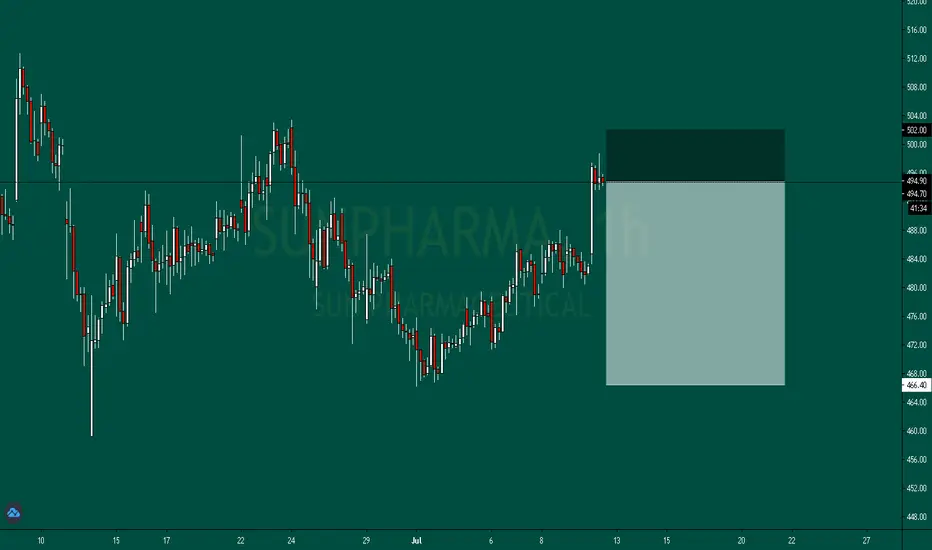
Sunpharma 10 July 2020Sunpharma 10 July 2020
Sunpharma buy @ 490
We have given this signal with the trend on daily charts comparing the 1he candle chart trends since 1 month. Clearly a winner deal.
Book profits at good levels clients.
Sunpharma levels are clearly explained in the picture.
Our analysis is based on 1 Hr charts and we believe 1 hour charts are a perfect tool for the daily trends and intraday analysis. Our support and resistancelevels are unlike others , we opt for hourly charts and technical analysis . Our analysis is based on levels , algorithms which we created , beyondtechnical analysis and mathematical equations and derivatives.
In the chart you can see the red and blue rounds. Clearly it shows the Supprt and resistance levels with accurate dynamics.
Sometimes we work on daily and weekly charts too for derivatives and fundamental analysis .
It’s a good idea to short sell at the current price as it’s averaging there.
Top resistance and Support is given clearly.
However average sell can be given at current price.
The lower highs and the lower lows give are also clearly explained and detailed for our intraday Analytics.
Our ideas and levels are our own created and out of our strong fundamental basic knowledge on trading and the self created analysis. That’s the reason we are highly accurate on forecasts we give.
Contact me for more analysis and recommendations.


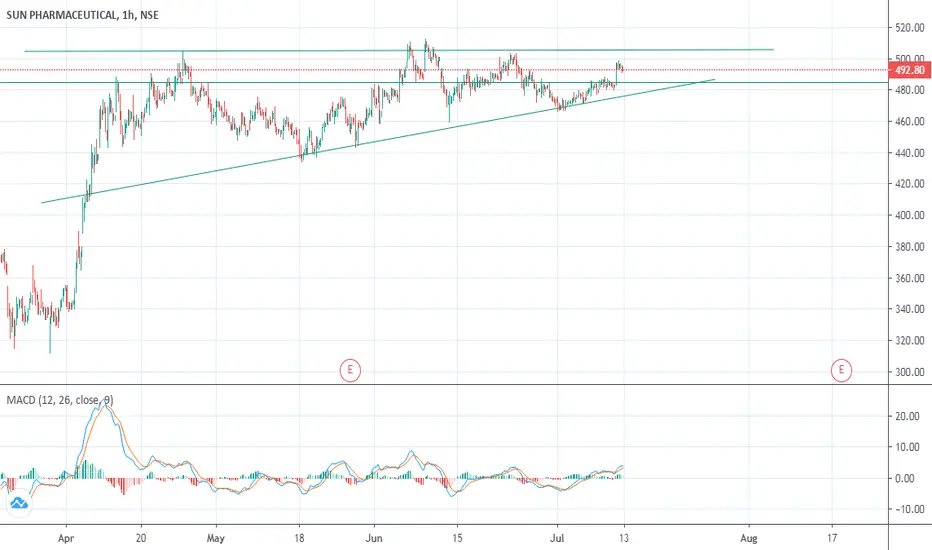
sun pharmafibonacci retracement and time chart are showing once it crosses 495 ie 50% retracement it will target 538 that is 61.8% retracement


SUNPHARMA Bullish on 2H chartNSE:SUNPHARMA
Sunpharma on 2H chart looks bullish above 484 for swing trade.
Possible targets for this trade will be 490,495 and 503
I prefer to keep my stop loss near 471.
Both my entry and exit will be as per 2H candle closing basis.


2.5R Trade- RSI creating regulr divergence by not creating Lower Low with price
- Break of Down Trending Channel.
- Trade the pit for a good RR if it gets filled


